Real World Impact
/
GTM Reporting
Transforms early-stage stall signals into a measurable indicator of pipeline efficiency over time.
Ask
Interpret
~ 1 min
Plan
Review
~ 1 min
Approve
Verify
~ 1 min
Execute
Compose
~ 1 min
Present

Analyzed 36,200 opportunities to quantify quarter-over-quarter trends in Stage 1 stalls and their effect on early-to-late stage progression.

DATA SOURCE
Salesforce Logo
Salesforce
Hubspot Logo
HubSpot
CATEGORY
RevOps
COMPLEXITY
Advanced
ANALYSIS TIME
Manual:
~3.5 hrs
Petavue
~15 mins
See the Full Analysis in Action

Watch how Petavue builds and runs this workflow — validating fields, generating the plan, and producing insights in minutes.

The Petavue Workflow
Blue circle
Ask

Uncover the Right Questions

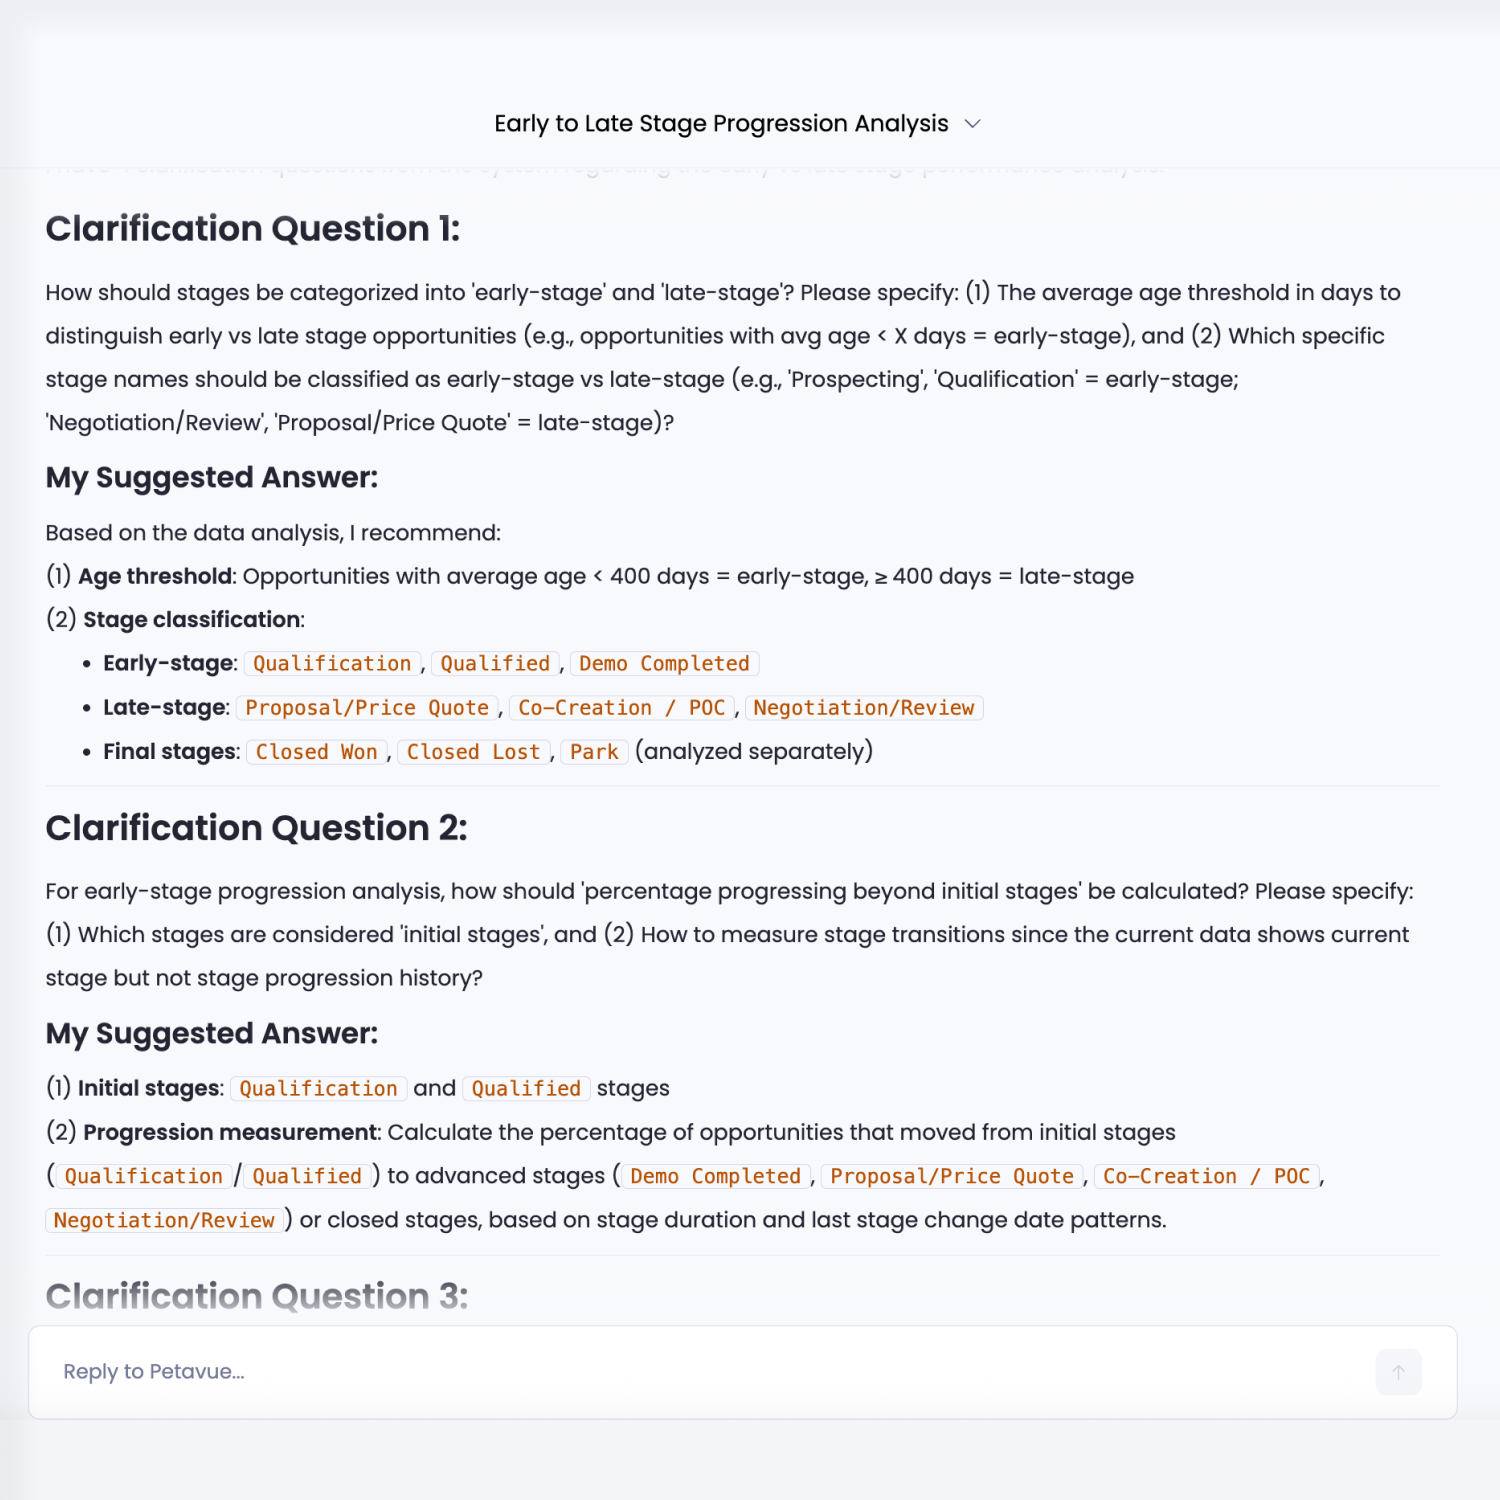
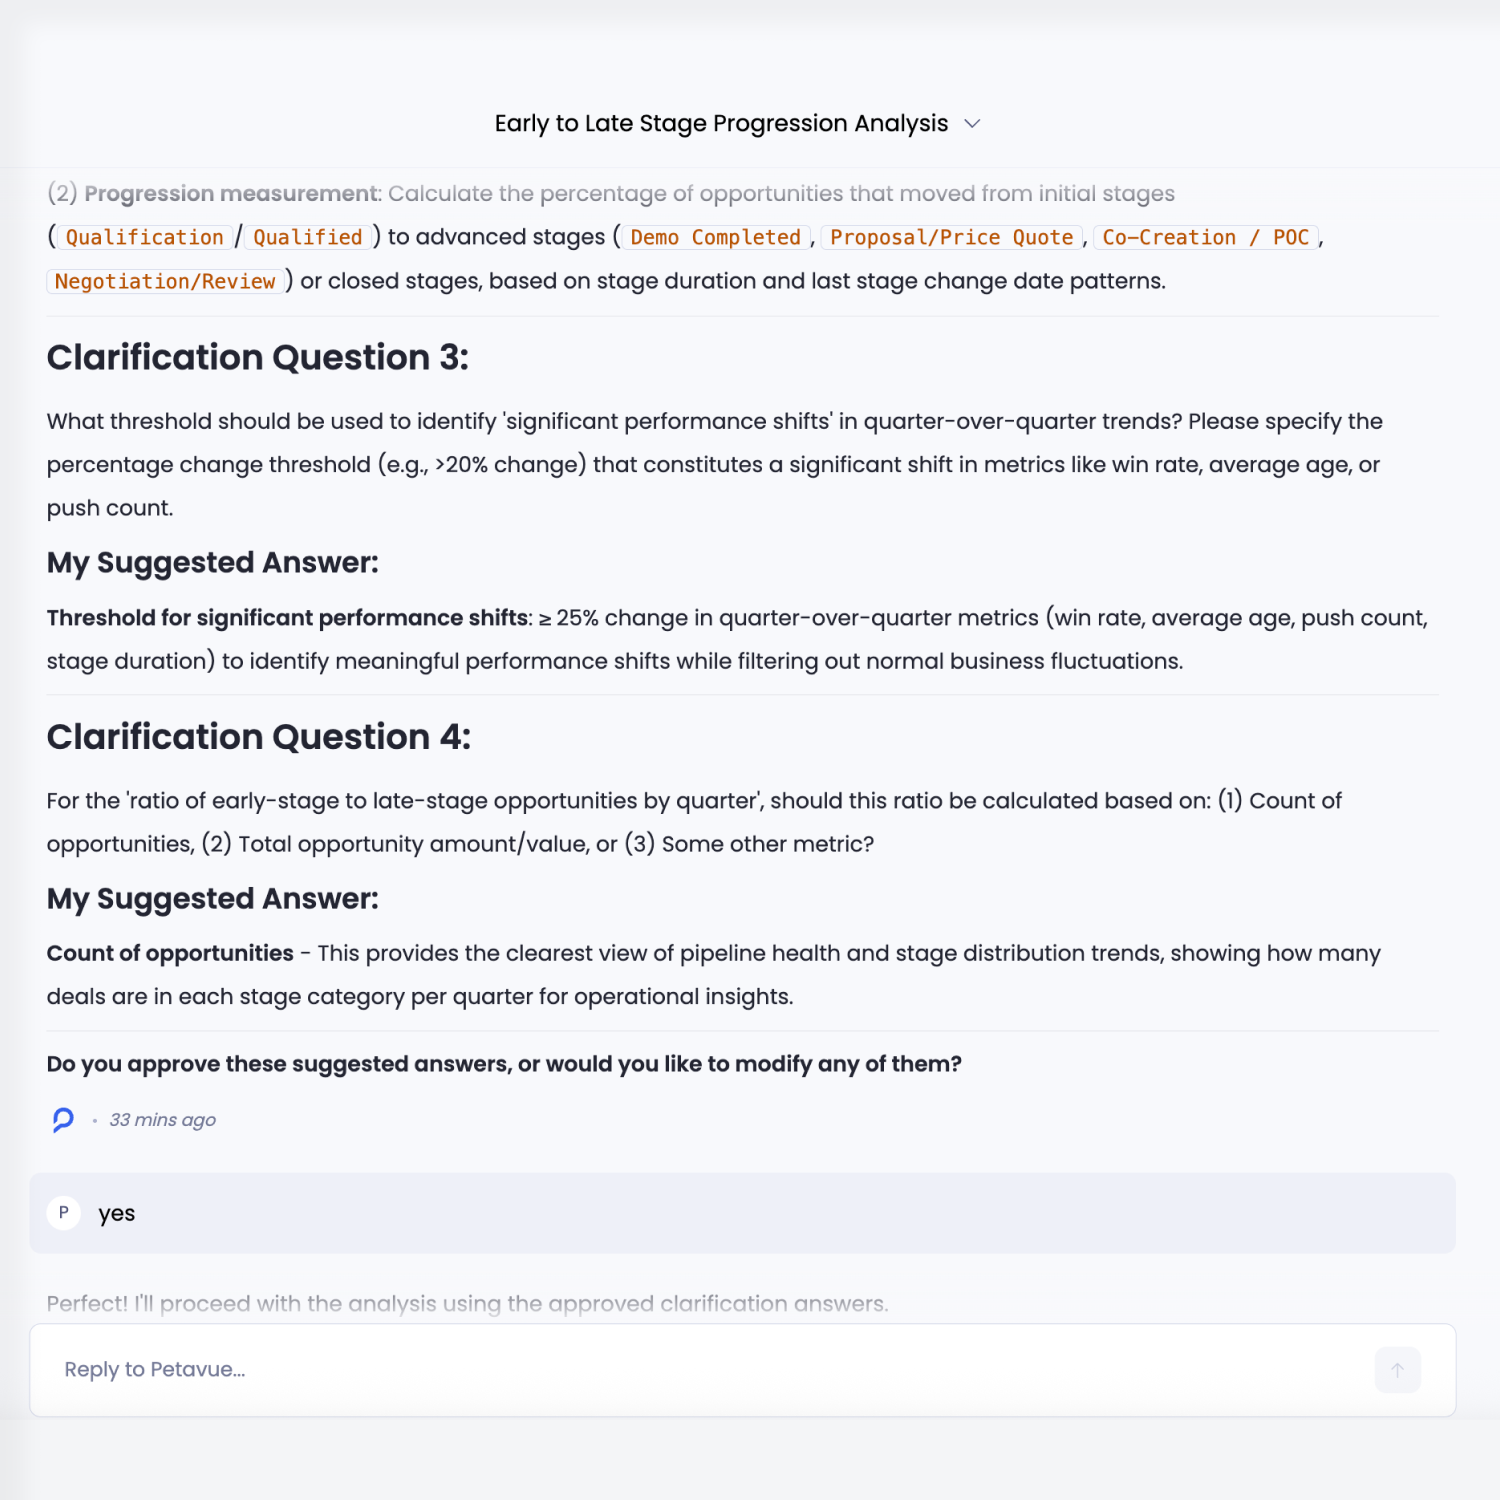
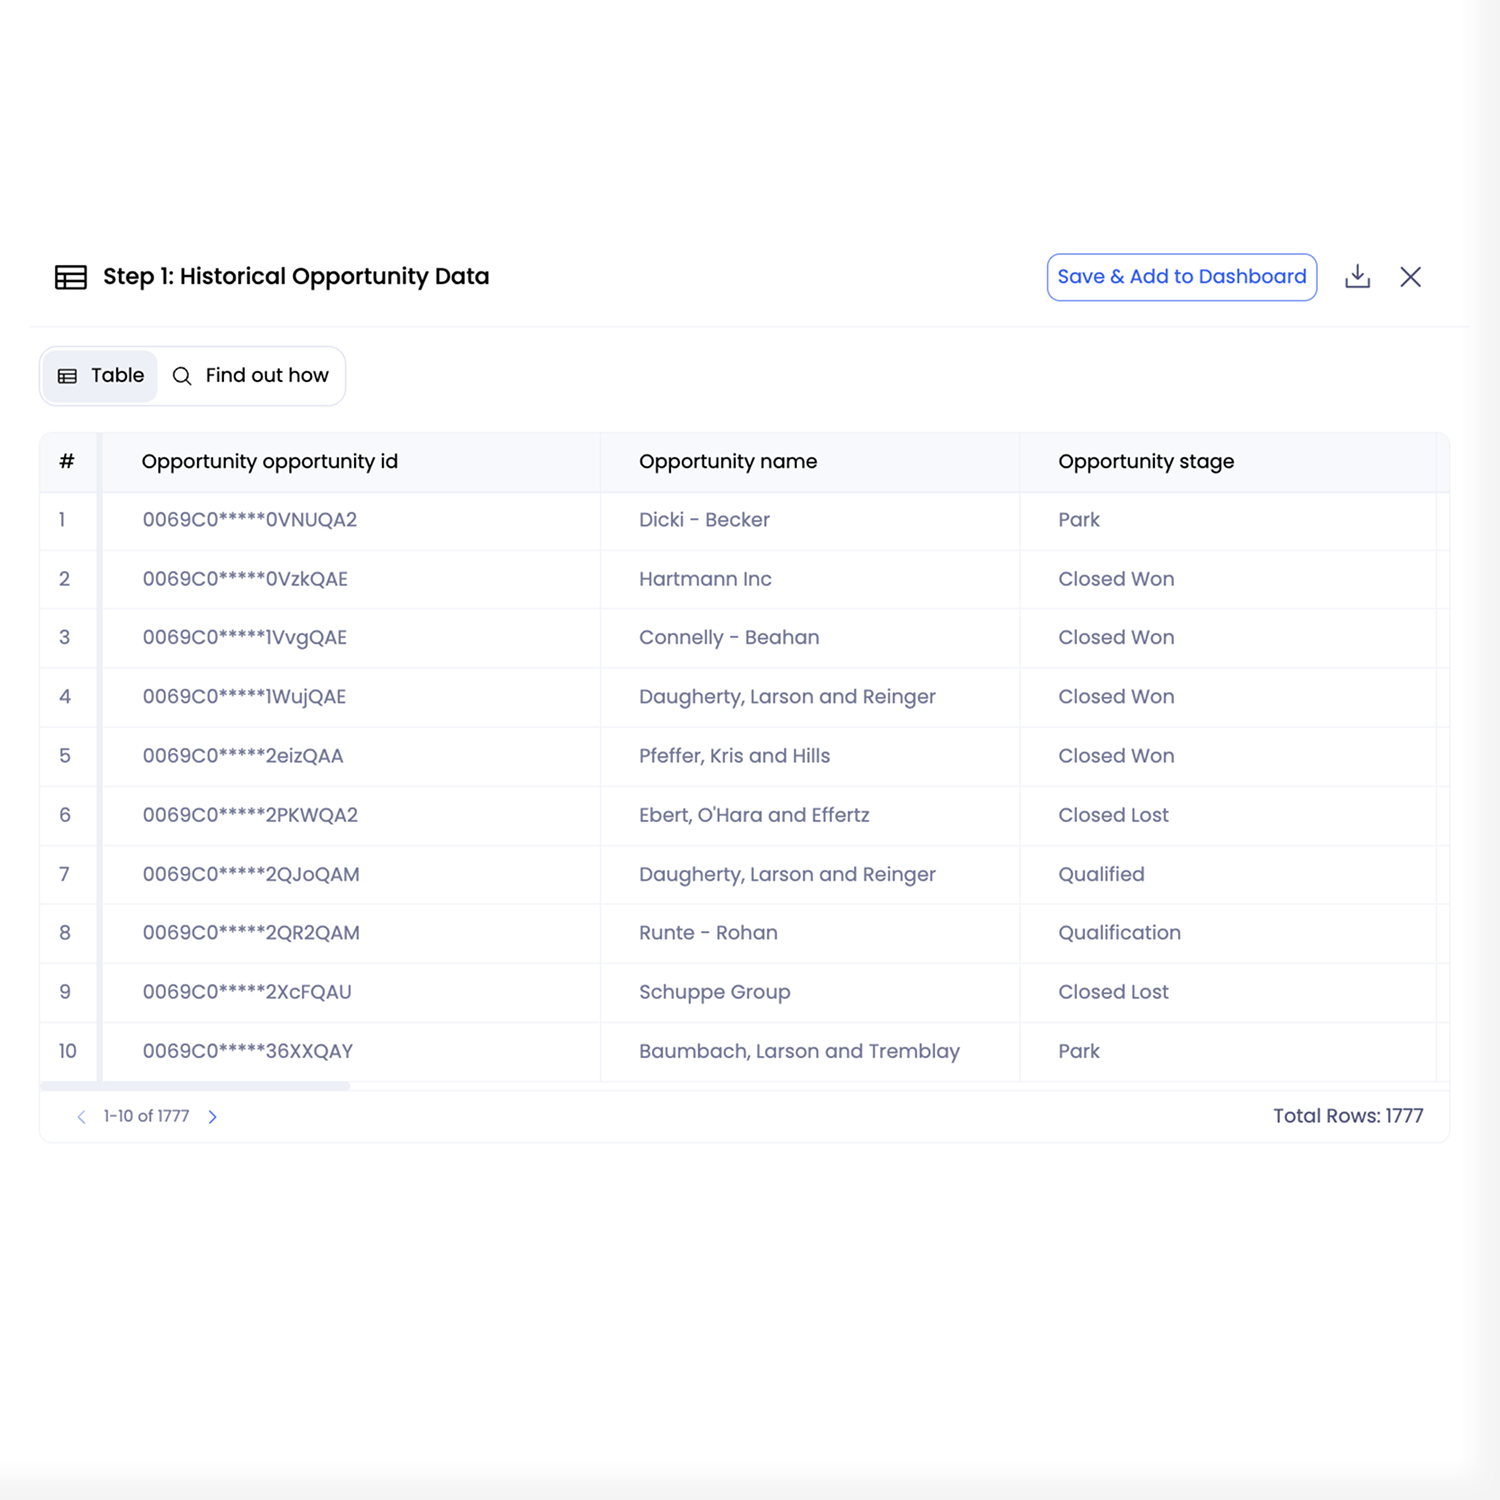
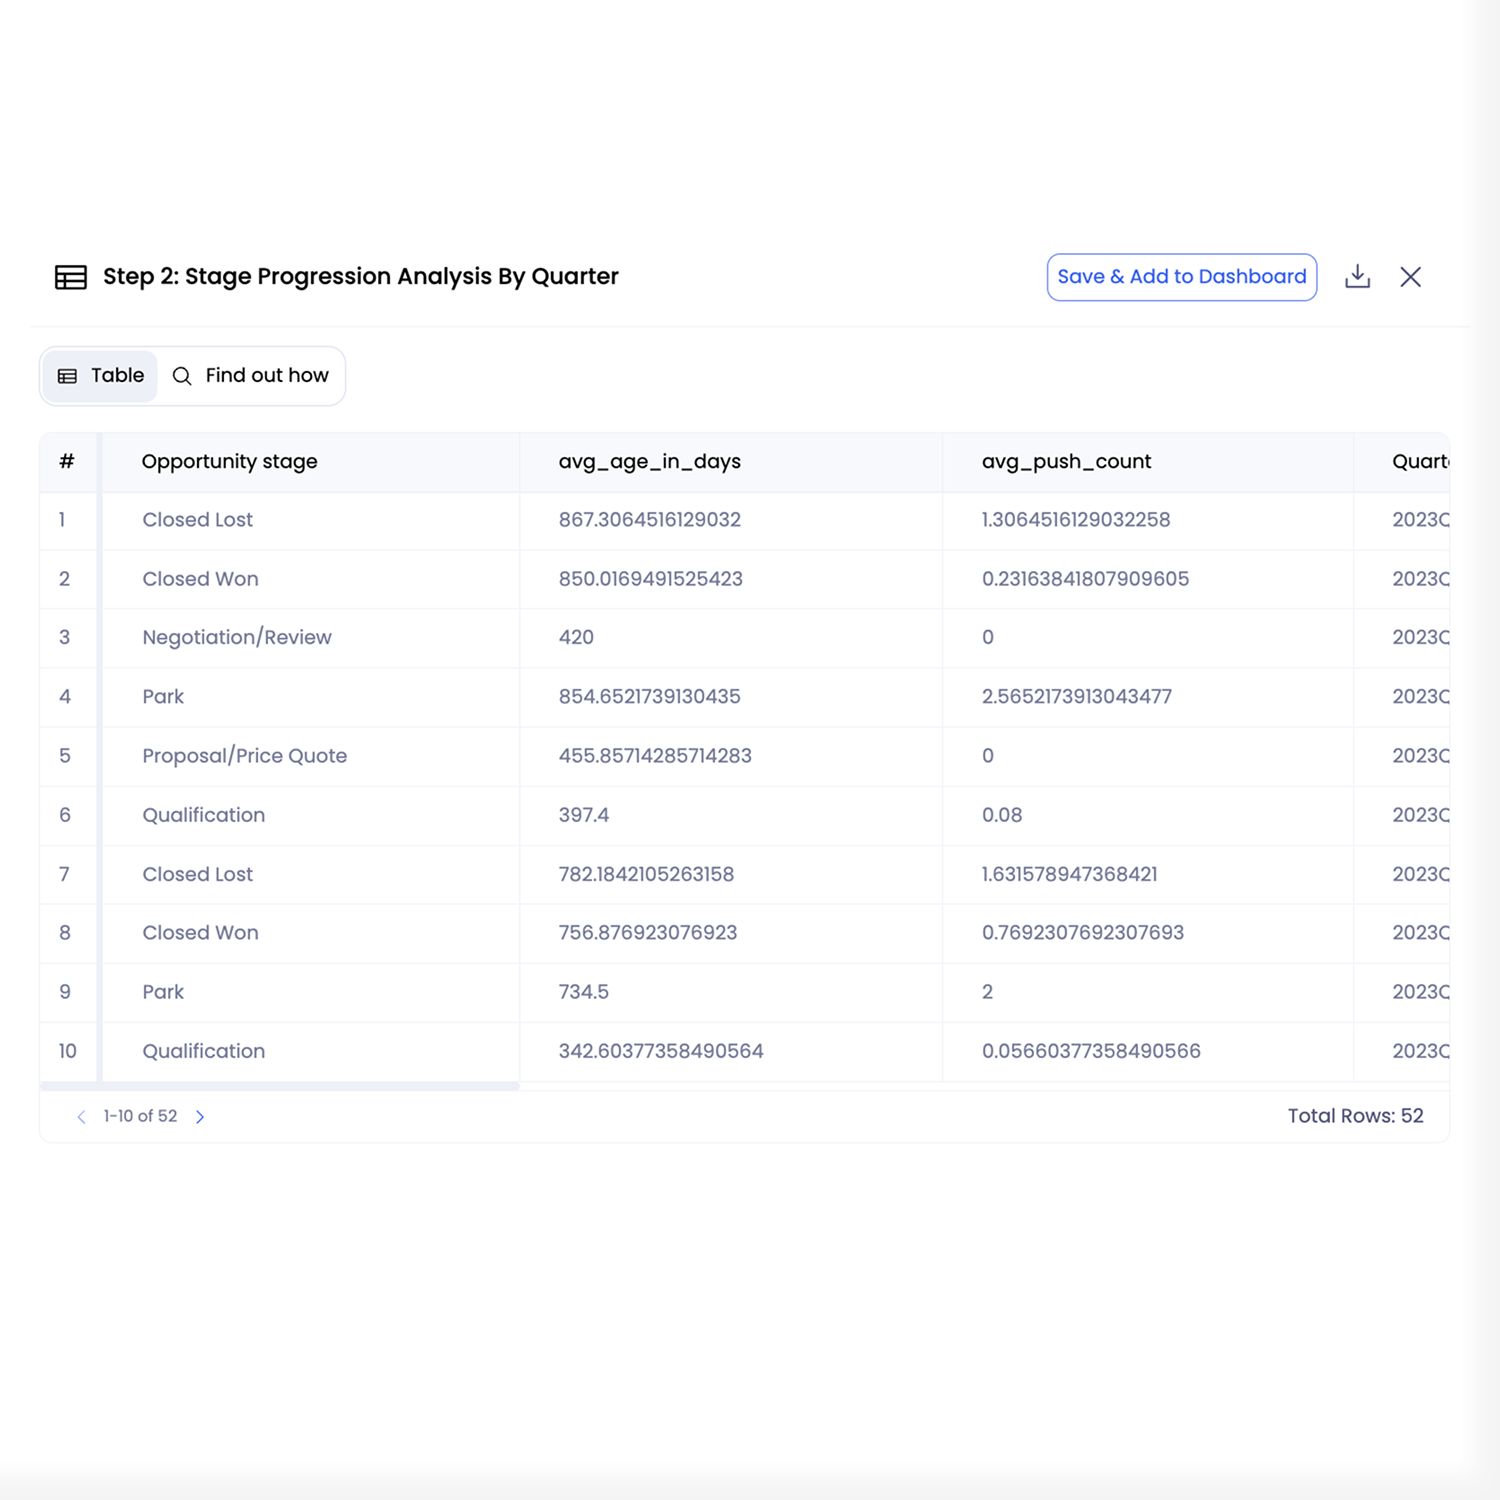
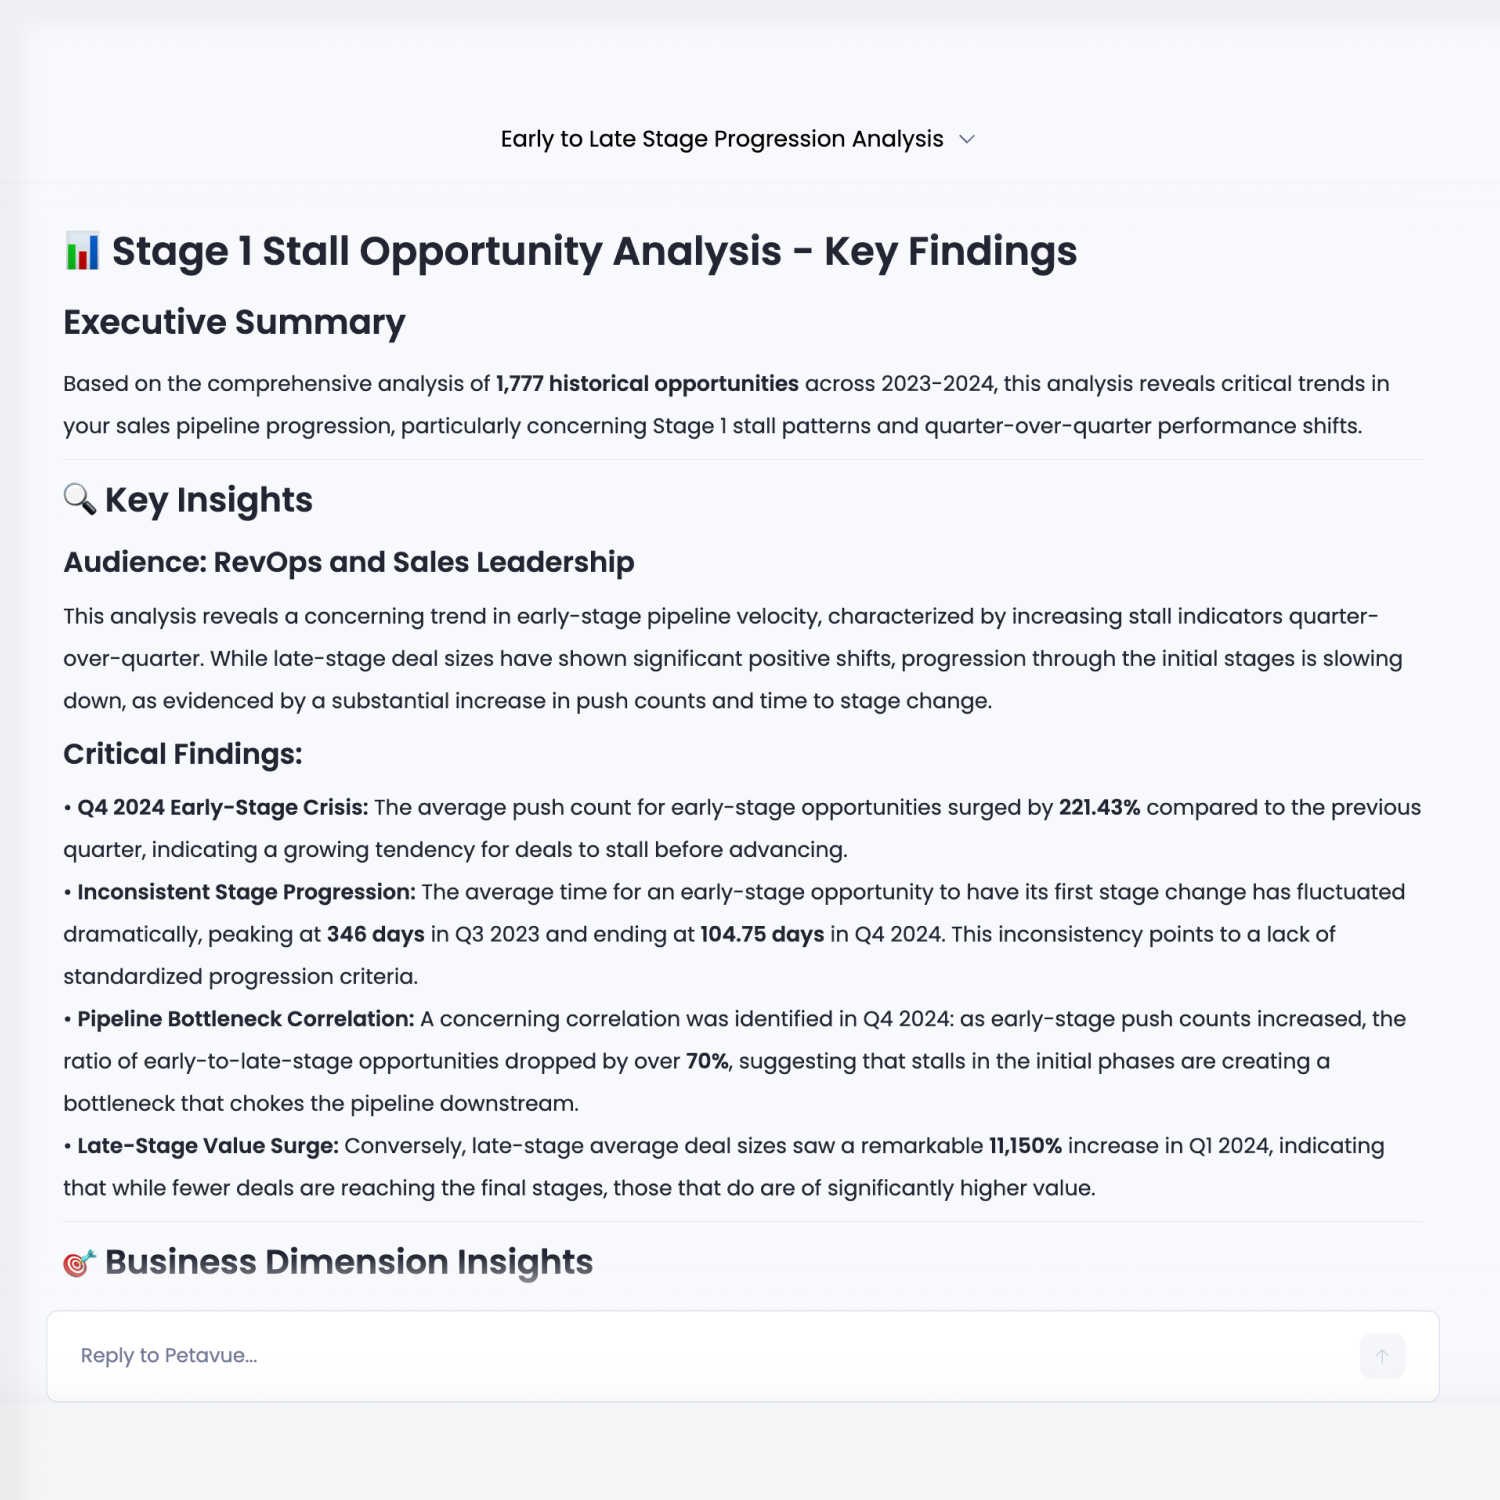
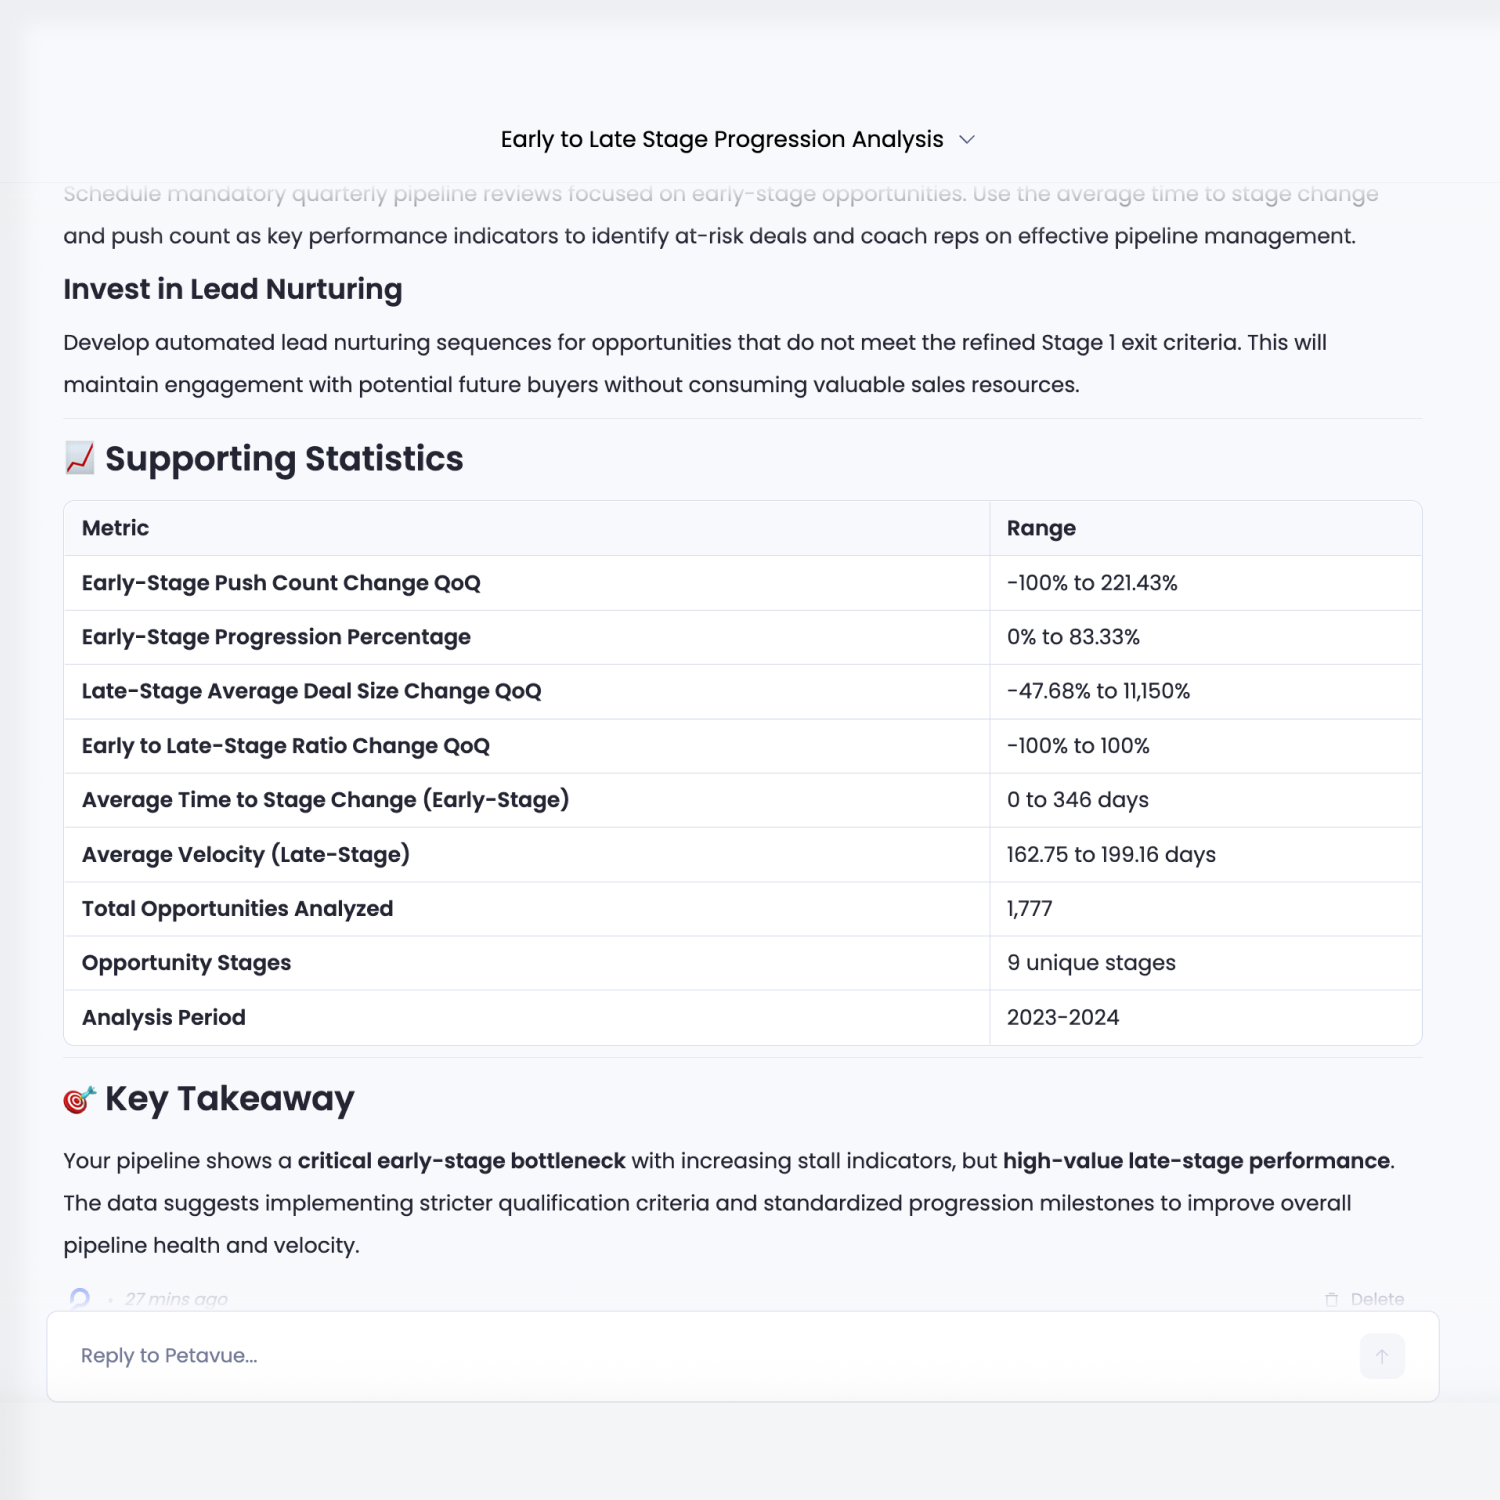
The request asked Petavue to assess historical trends tied to the Stage 1 Stall indicator and determine how early-stage delays affect progression into later stages over time.Petavue interprets the intent behind the question—understanding whether improvements (or regressions) in early execution are translating into healthier, more predictable pipeline performance quarter over quarter.

Using historical trends on the Stage 1 stall opportunity field, are there any trends or key analyses on how we're performing
Interpret
~ 1 min
Plan

Craft the Plan

Petavue translates the request into a structured analytical plan.It selects the Salesforce Opportunities table along with stage history and the Stage 1 stall field. Required fields include opportunity creation date, stage timestamps, stall indicators, progression milestones, close outcomes, and fiscal quarter.Petavue defines how stall rates will be measured per quarter and how early-to-late stage conversion will be tracked and compared over time.

Review
~ 1 min
Approve

Confirm the Approach

Before execution, Petavue presents the methodology in plain language.It explains how Stage 1 stalls are identified, how progression rates are calculated across quarters, and how trends will be normalized to account for volume fluctuations—ensuring stakeholders align on how performance will be evaluated.

Verify
~ 1 min
Execute

Ensure Accurate Execution

Petavue executes the approved analysis across historical opportunity data.It calculates quarterly Stage 1 stall rates, tracks progression from early to mid and late stages, and compares conversion efficiency across periods.All calculations are validated at the individual opportunity level, producing trend lines grounded in real deal behavior.

Compose
~ 1 min
Present

Surface the Insights

Petavue presents the findings as trend-based insights.It highlights quarter-over-quarter changes in early-stage stall rates, shows how those changes correlate with downstream progression, and identifies inflection points where execution improved or deteriorated.The result is a clear narrative of how early-stage discipline (or lack of it) shapes overall pipeline health.

The Outcome

Petavue analyzed three years of Salesforce opportunity history (36,200 opportunities) to evaluate how Stage 1 stall behavior impacts progression through the funnel over time. By tracking quarter-over-quarter movement from early to late stages, Petavue uncovered clear performance trends—highlighting where conversion efficiency has improved, where it has declined, and how early-stage friction compounds downstream pipeline risk.

Stall Rate Trends

Identified sustained decreases in Stage 1 stall rates during specific quarters, followed by improved progression into late stages.

Conversion Efficiency

Demonstrated a strong correlation between reduced early-stage stalls and higher early-to-late stage conversion rates.

Performance Inflection Points

Surfaced quarters where changes in process, ownership, or volume materially impacted funnel flow.

FAQs

For any further questions, send us a message at support@petavue.com
What is considered a Stage 1 stall?
Opportunities that exceed the defined time threshold in Stage 1 without progression.
How is quarter-over-quarter performance measured?
By comparing stall rates and stage-to-stage conversion rates across fiscal quarters.
Does this account for seasonality or volume changes?
Yes. Metrics are normalized to ensure fair comparisons across quarters.
Can this be segmented further?
Yes—by region, owner, deal size, or source.
How can teams act on these insights?
By identifying quarters or segments where early execution improved outcomes and replicating those behaviors.