Real World Impact
/
GTM Reporting
Turns early-stage stagnation into a measurable pipeline risk signal.
Ask
Interpret
~ 1 min
Plan
Review
~ 1.5 mins
Approve
Verify
~ 2 mins
Execute
Compose
~ 1.5 mins
Present

Analyzed 9,840 opportunities created in 2025 to track outcomes for deals stalled over 30 days, globally and by region.

DATA SOURCE
Salesforce Logo
Salesforce
Hubspot Logo
HubSpot
CATEGORY
RevOps
COMPLEXITY
Advanced
ANALYSIS TIME
Manual:
~3 hrs
Petavue
~14.5 mins
See the Full Analysis in Action

Watch how Petavue builds and runs this workflow — validating fields, generating the plan, and producing insights in minutes.

The Petavue Workflow
Blue circle
Ask

Uncover the Right Questions

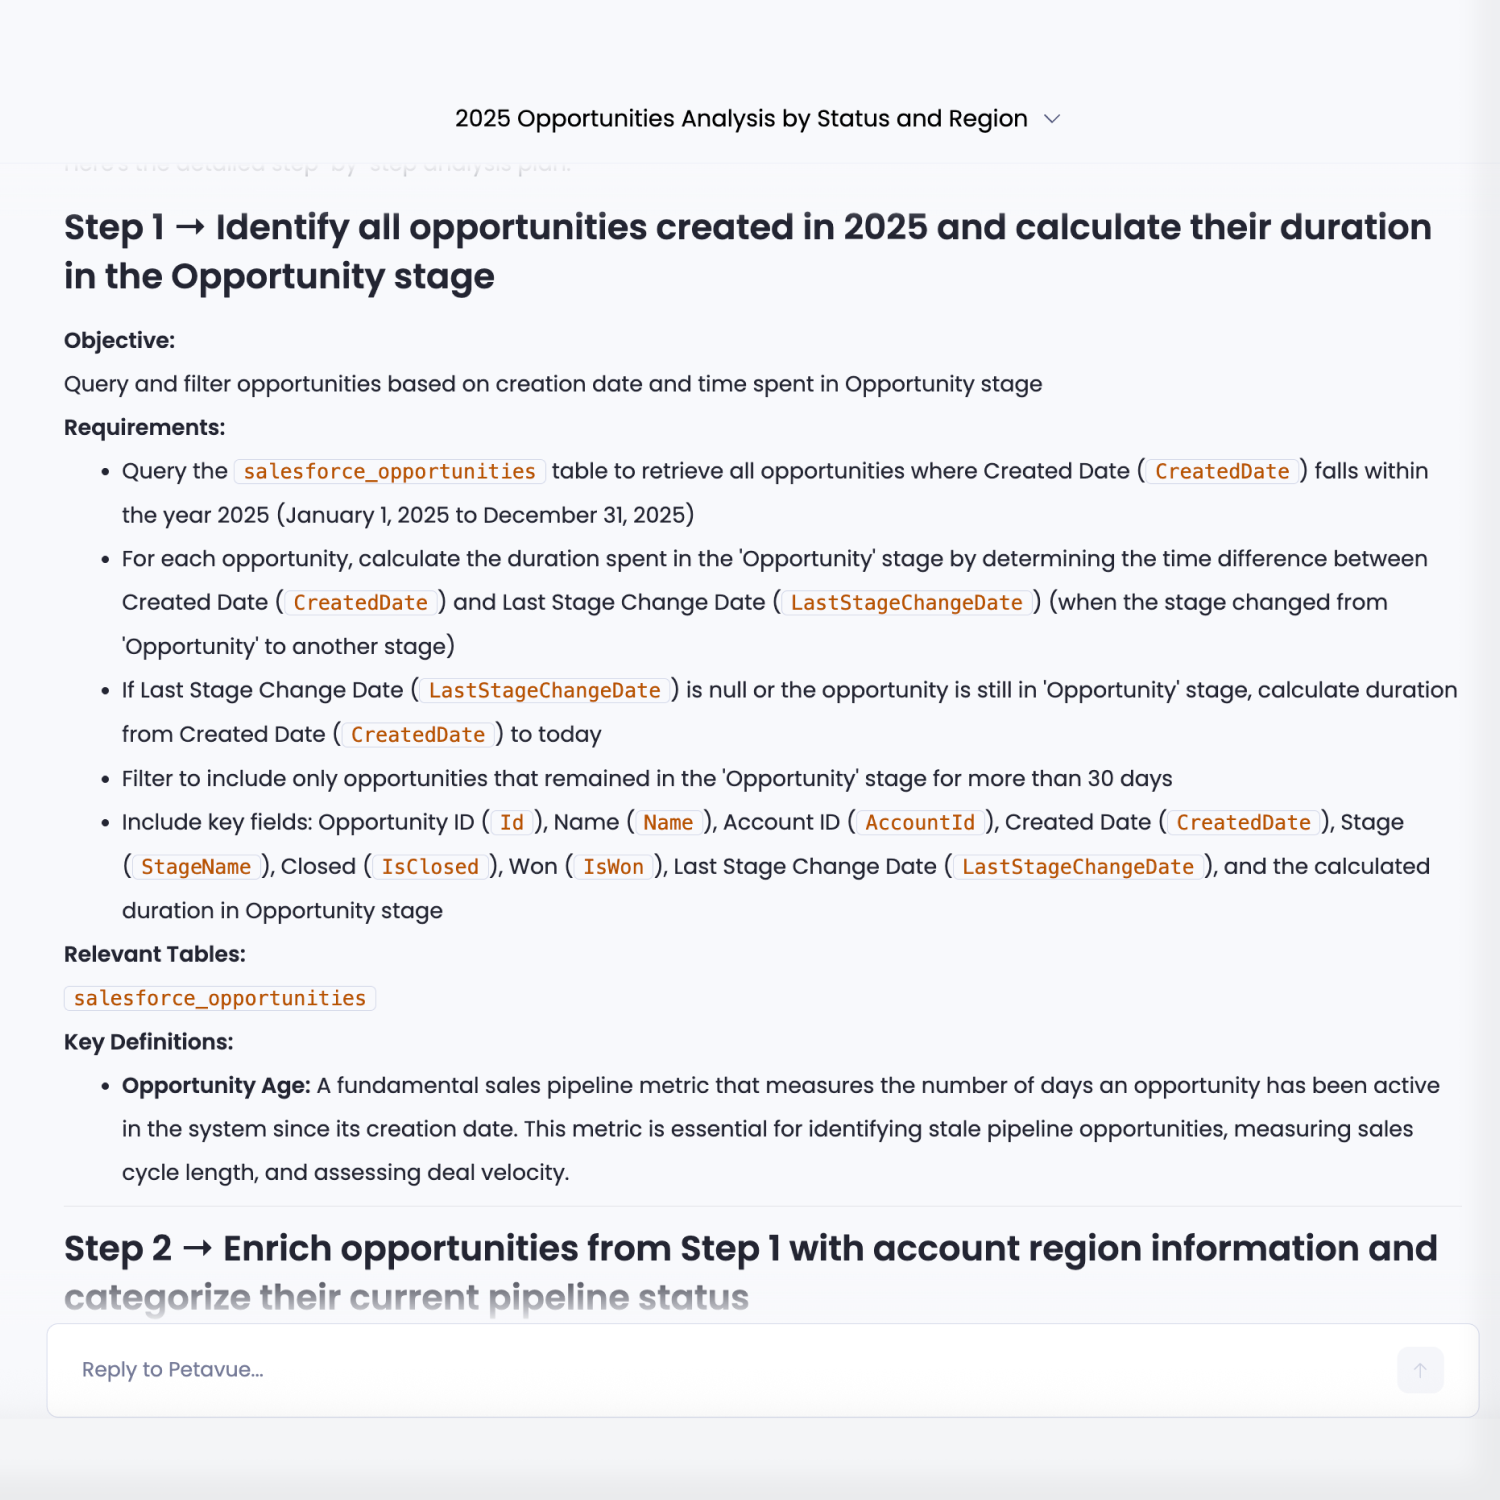
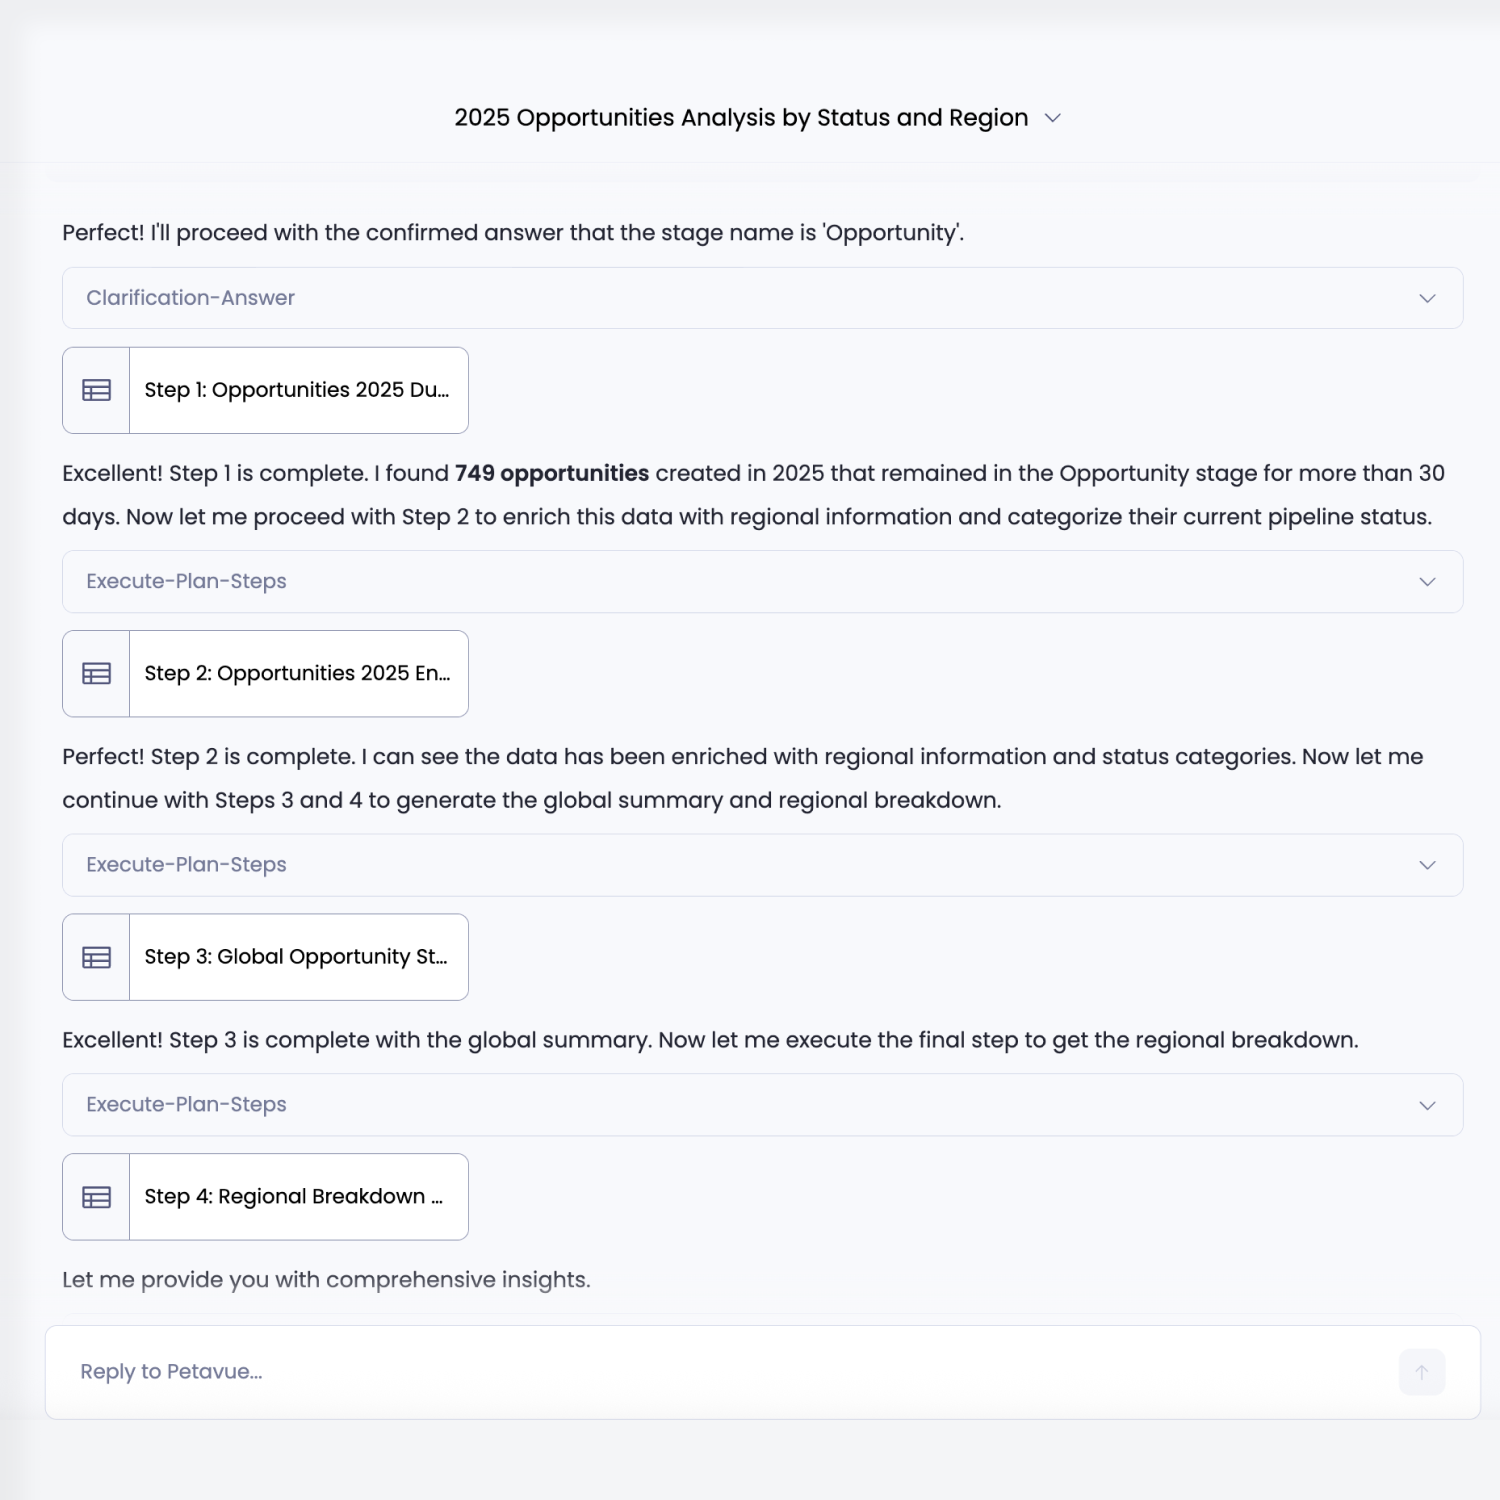
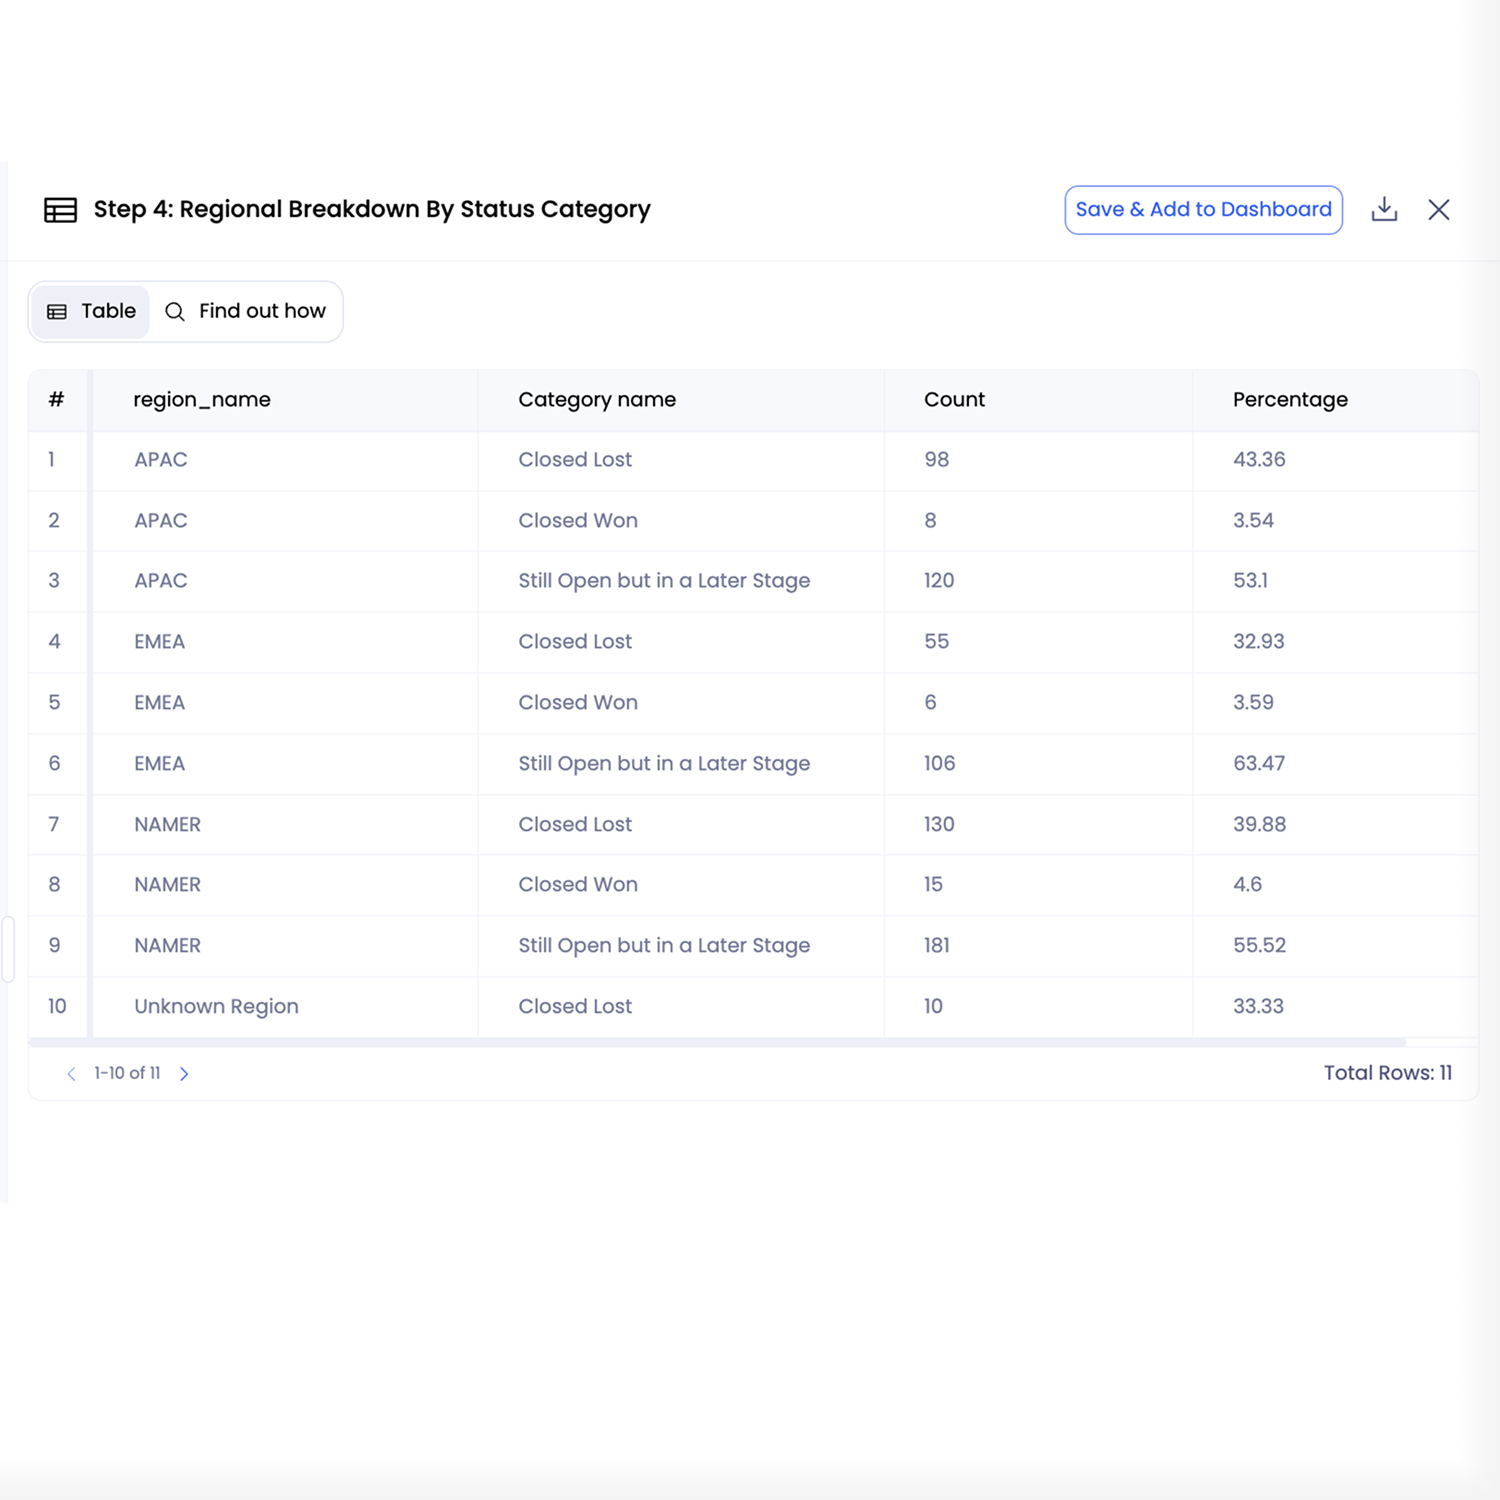
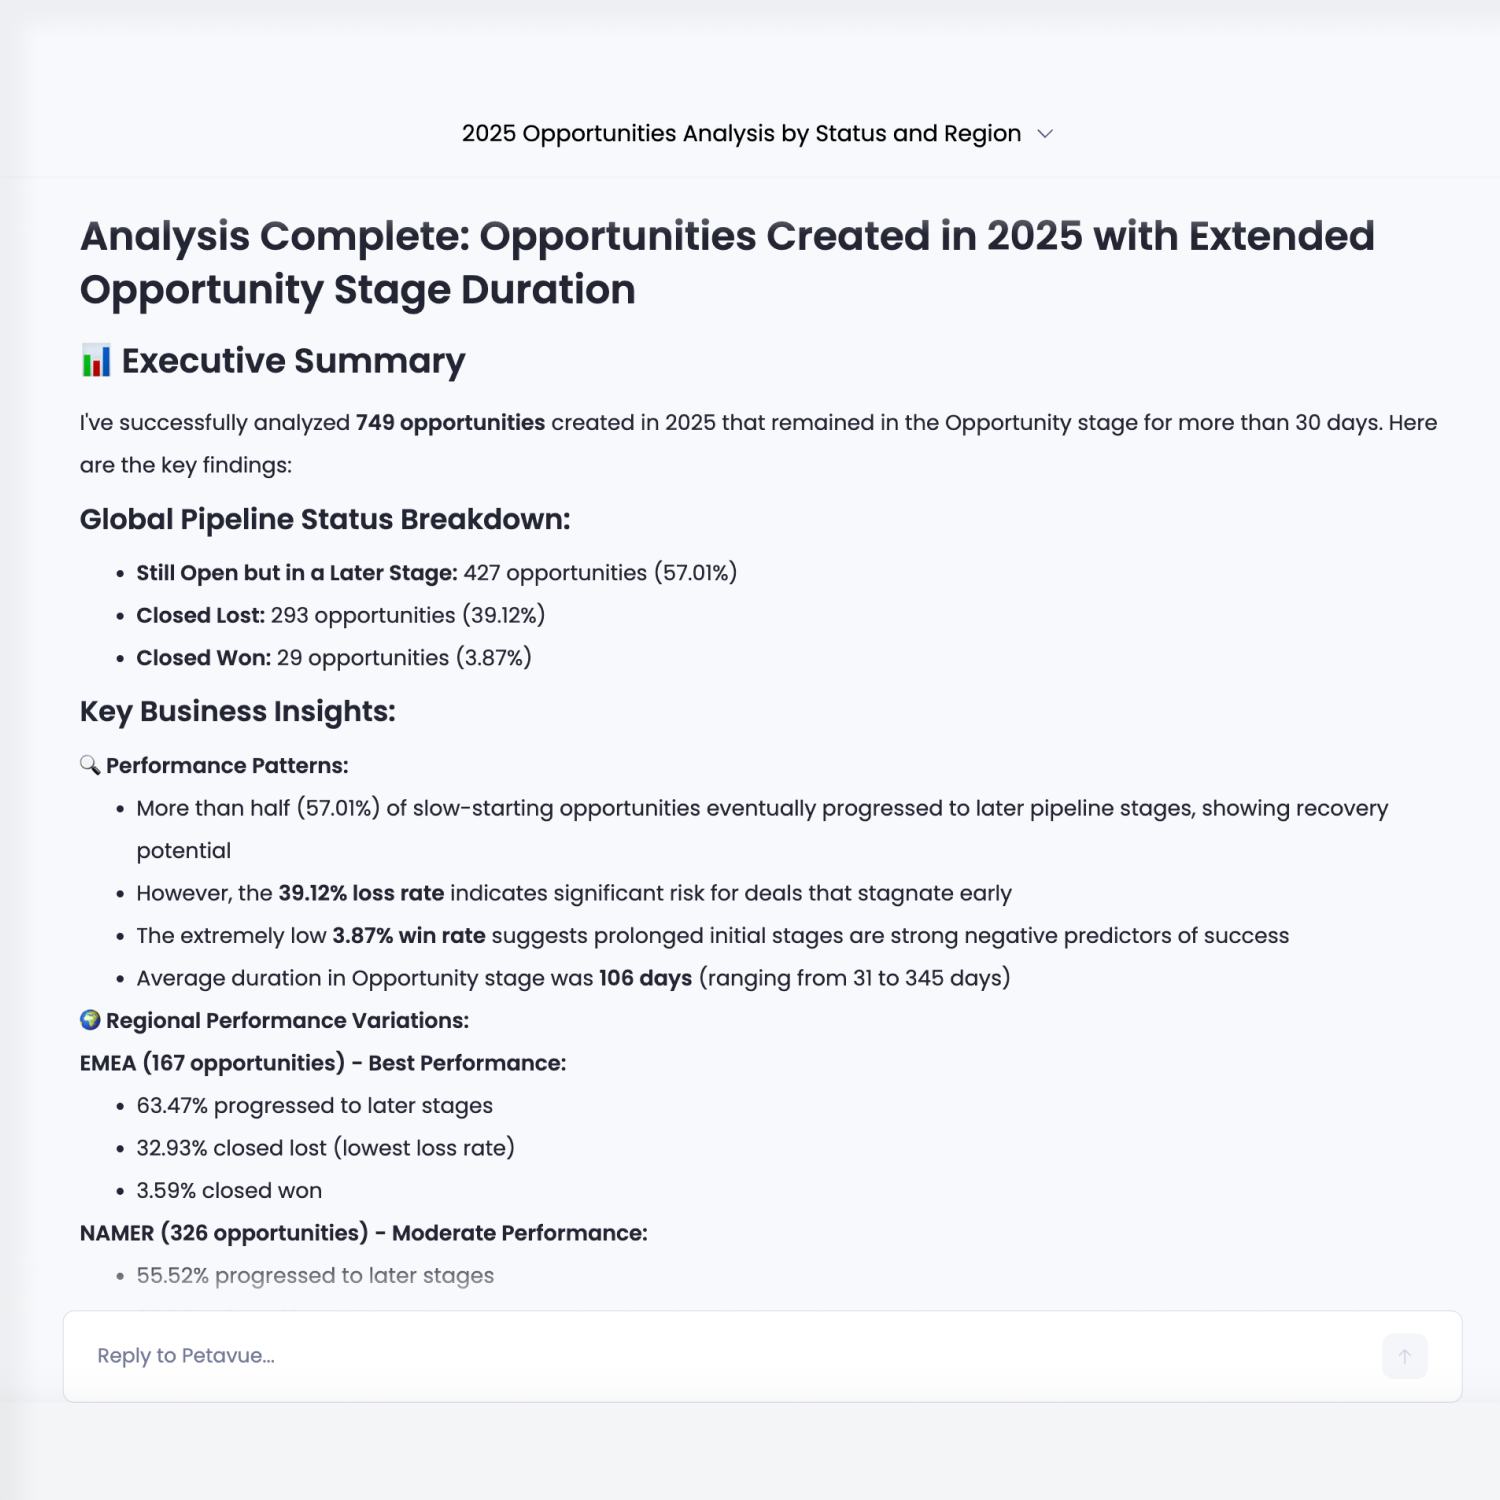
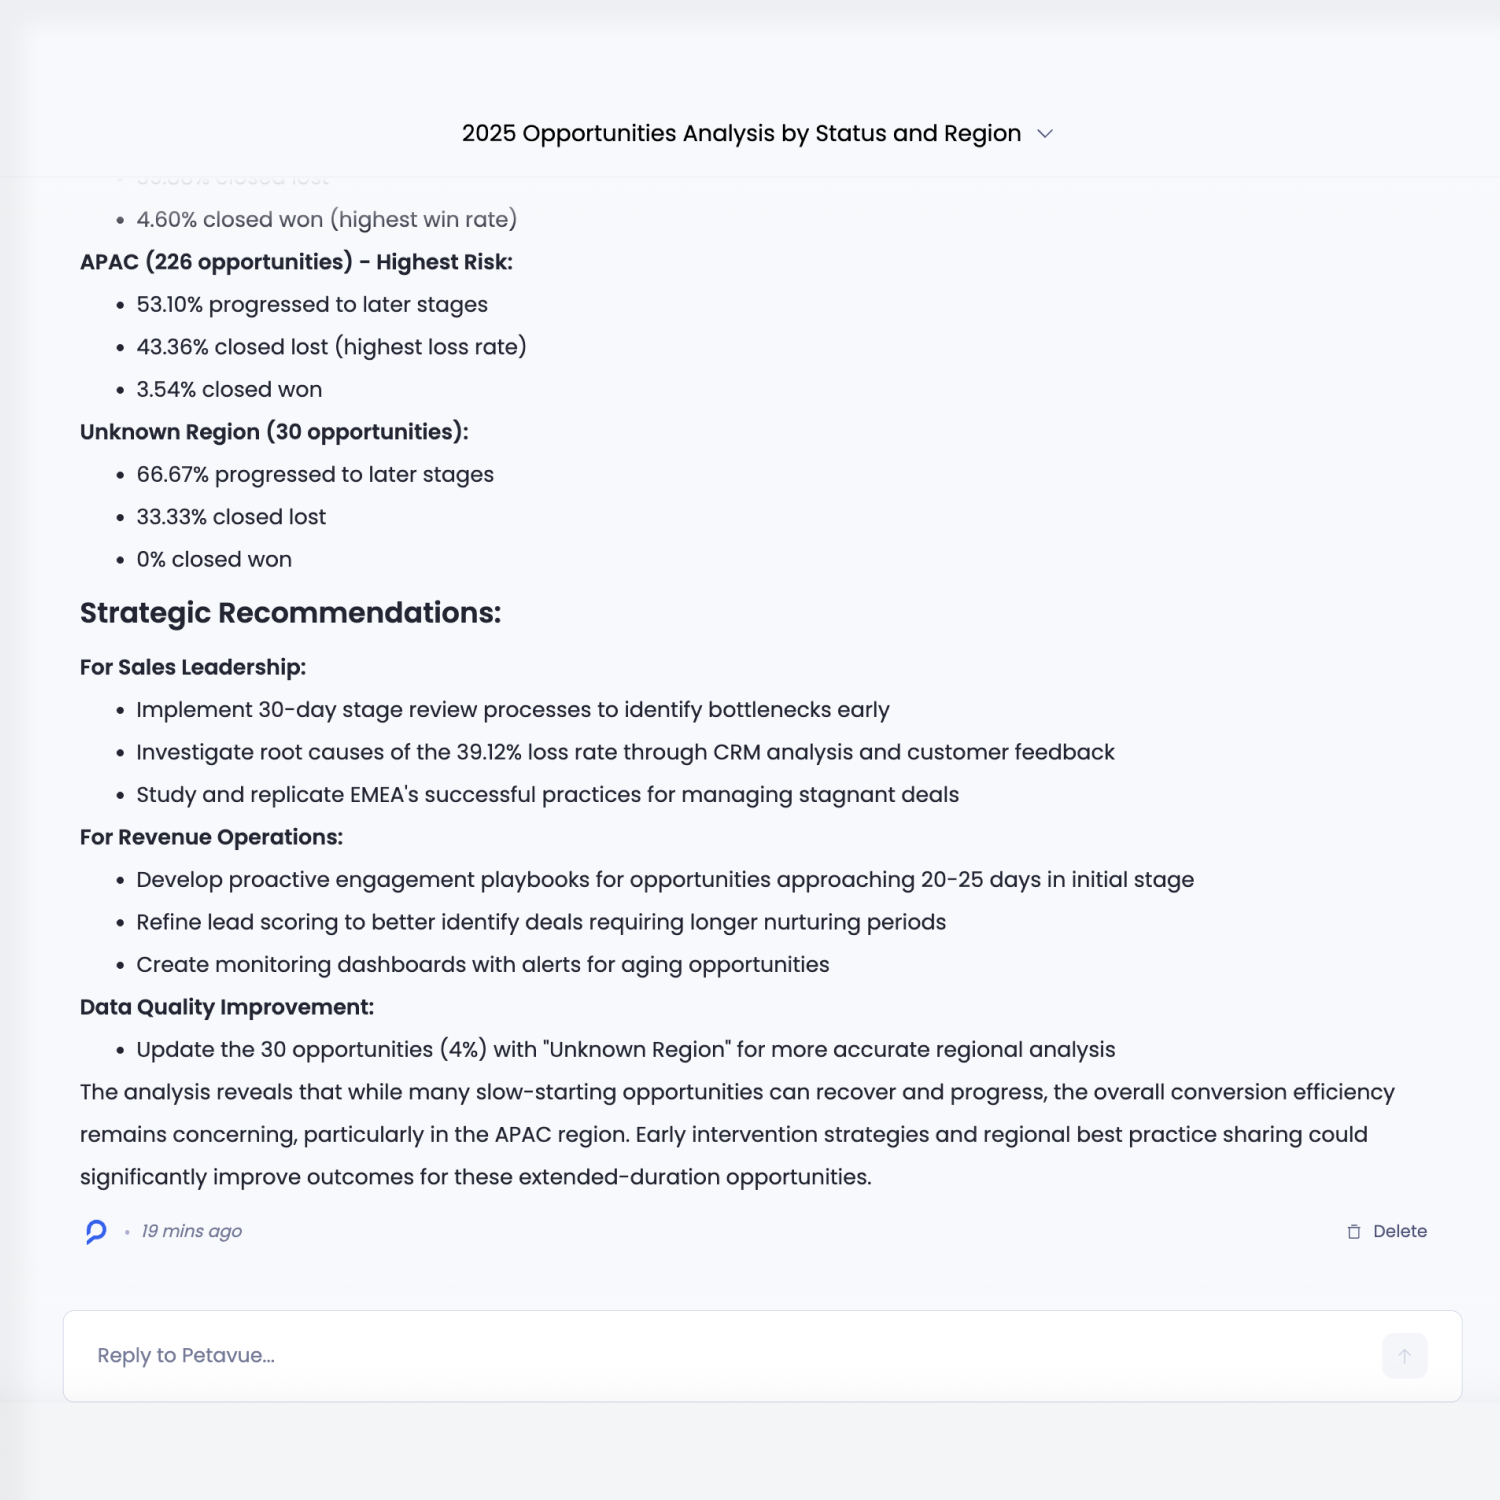
The request asked Petavue to isolate opportunities created in 2025 that experienced early-stage stagnation, determine their current pipeline outcomes, and break results down by region.Petavue interprets the intent behind the question—understanding whether prolonged time in Opportunity is a warning signal for deal risk, cycle inefficiency, or regional execution gaps.

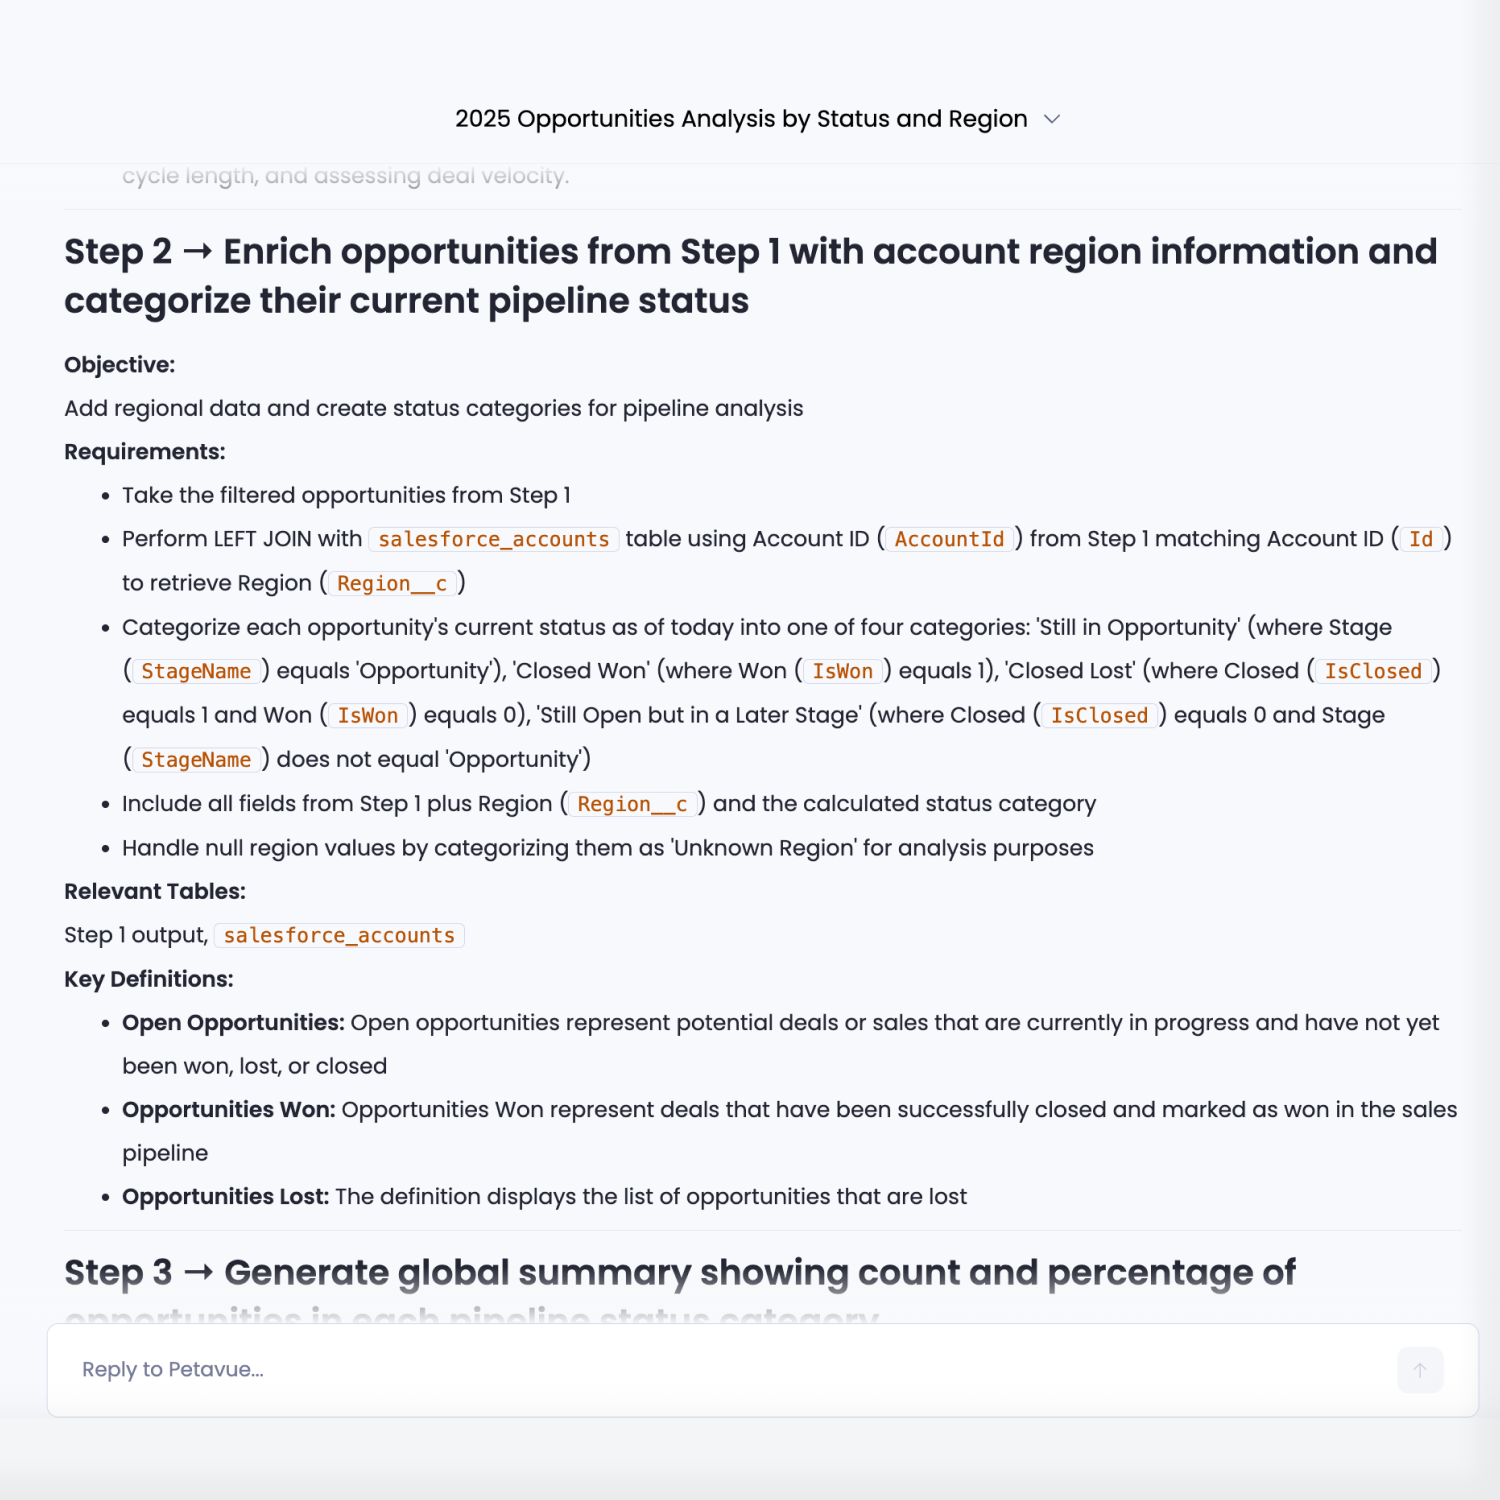
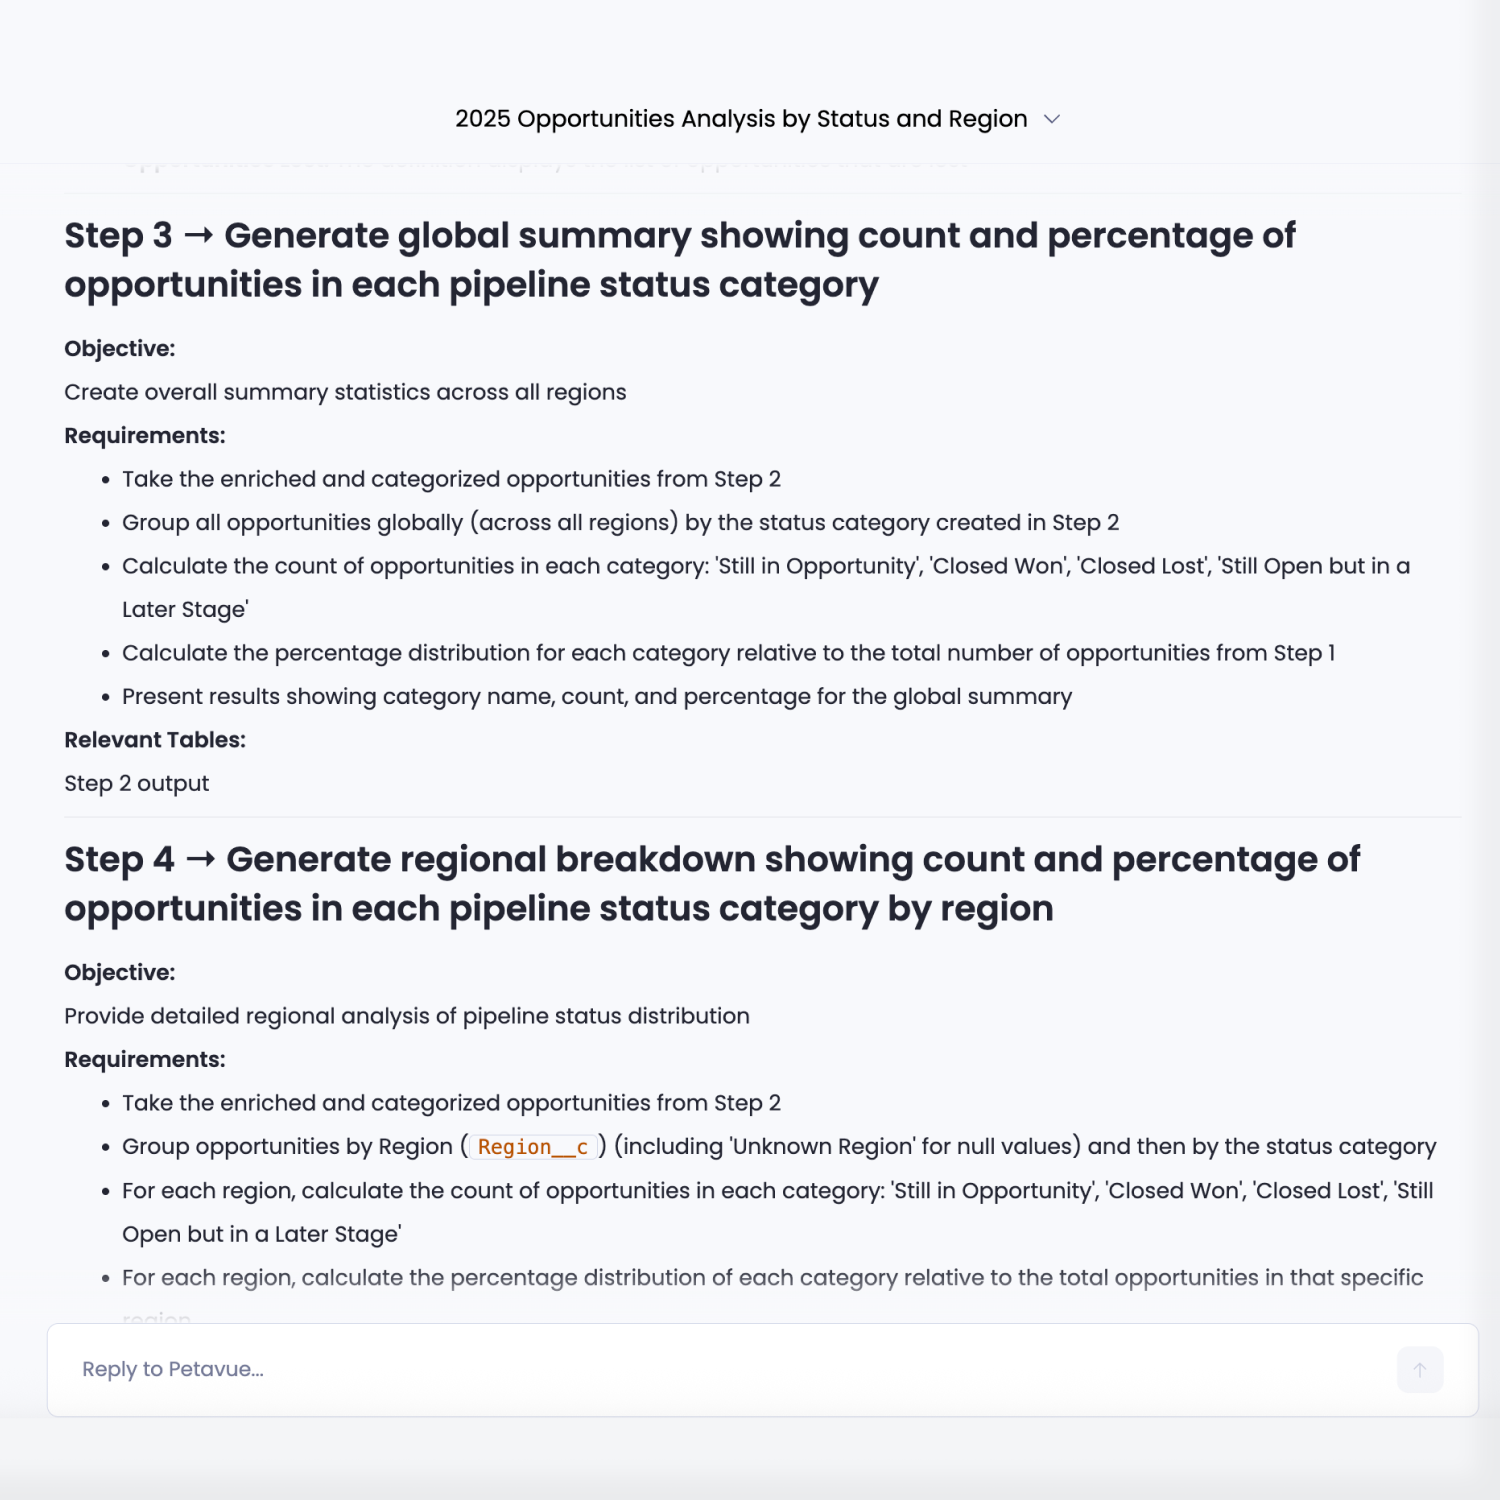
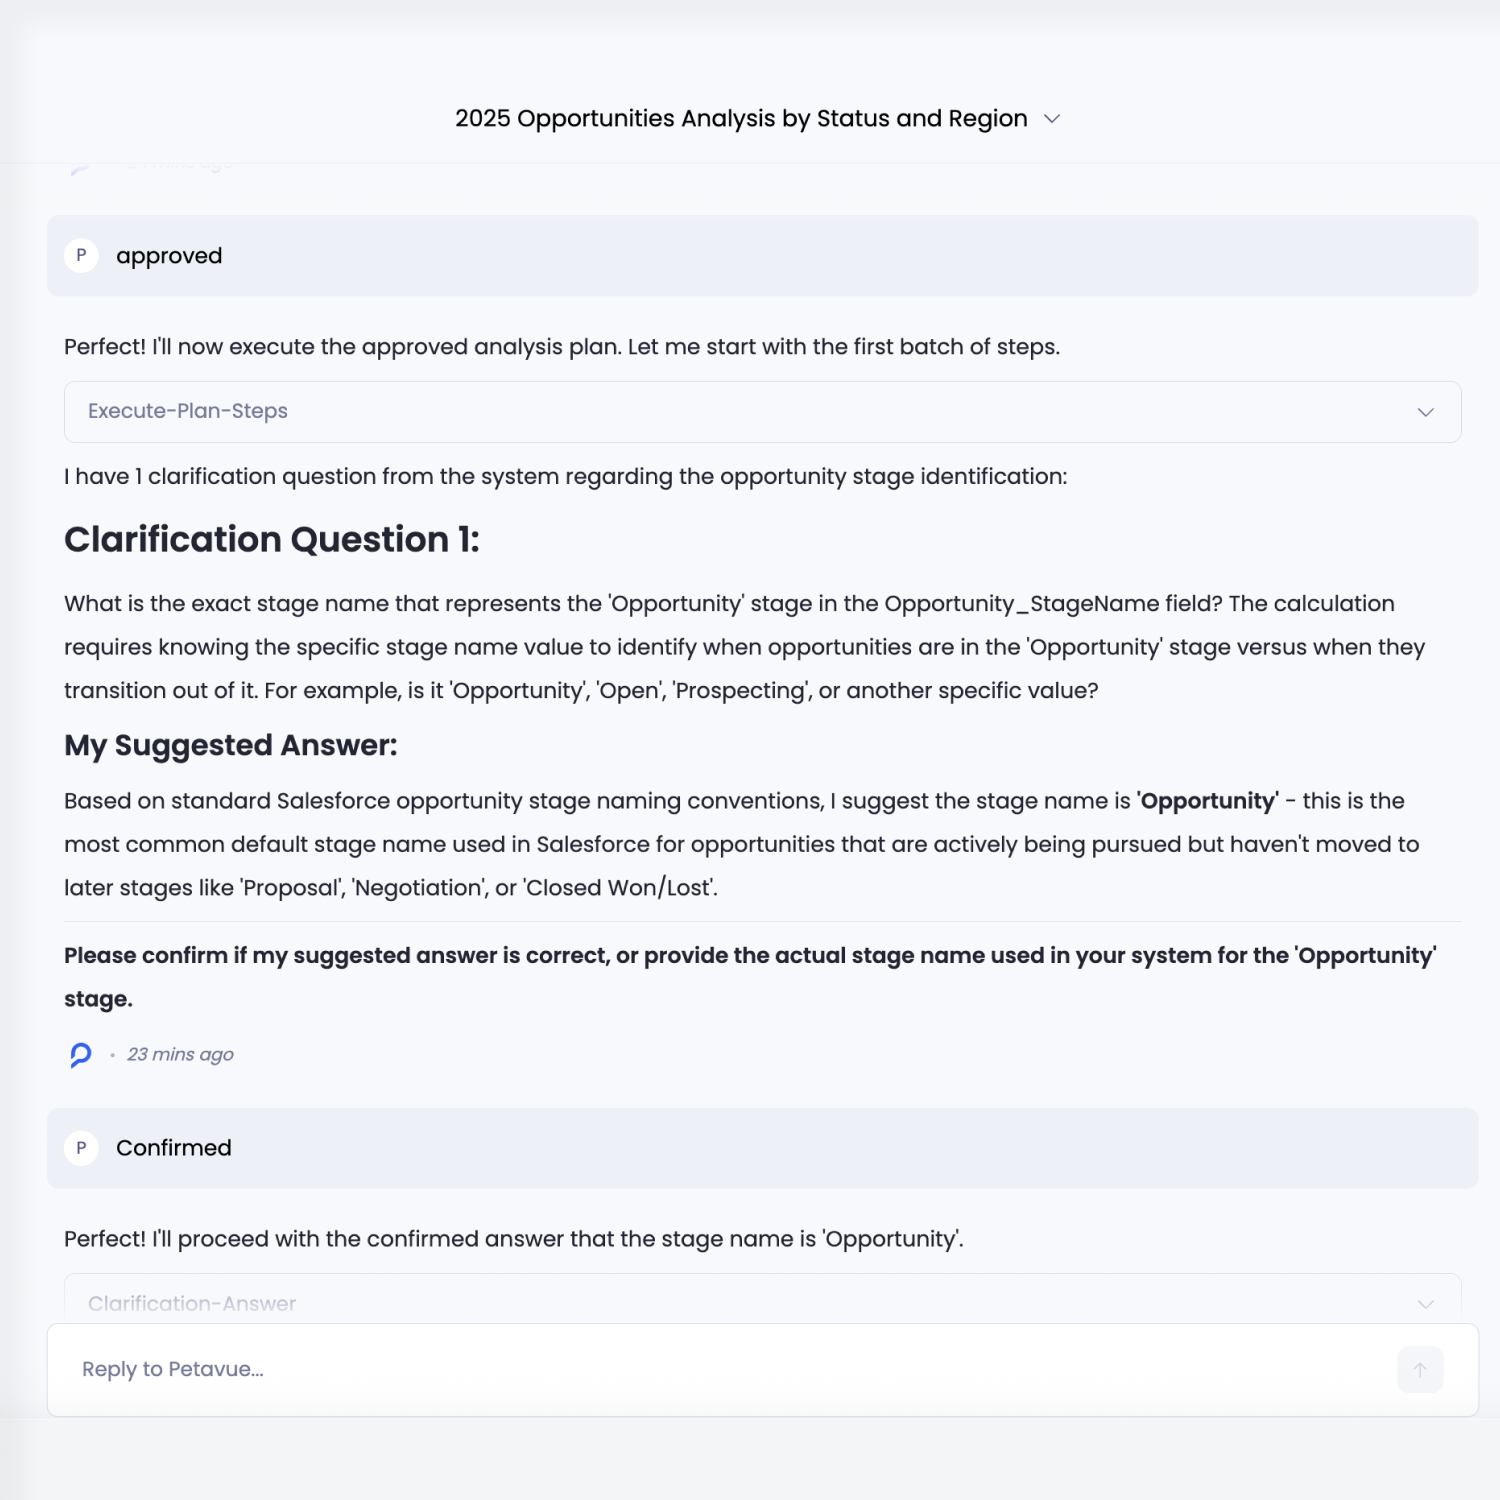
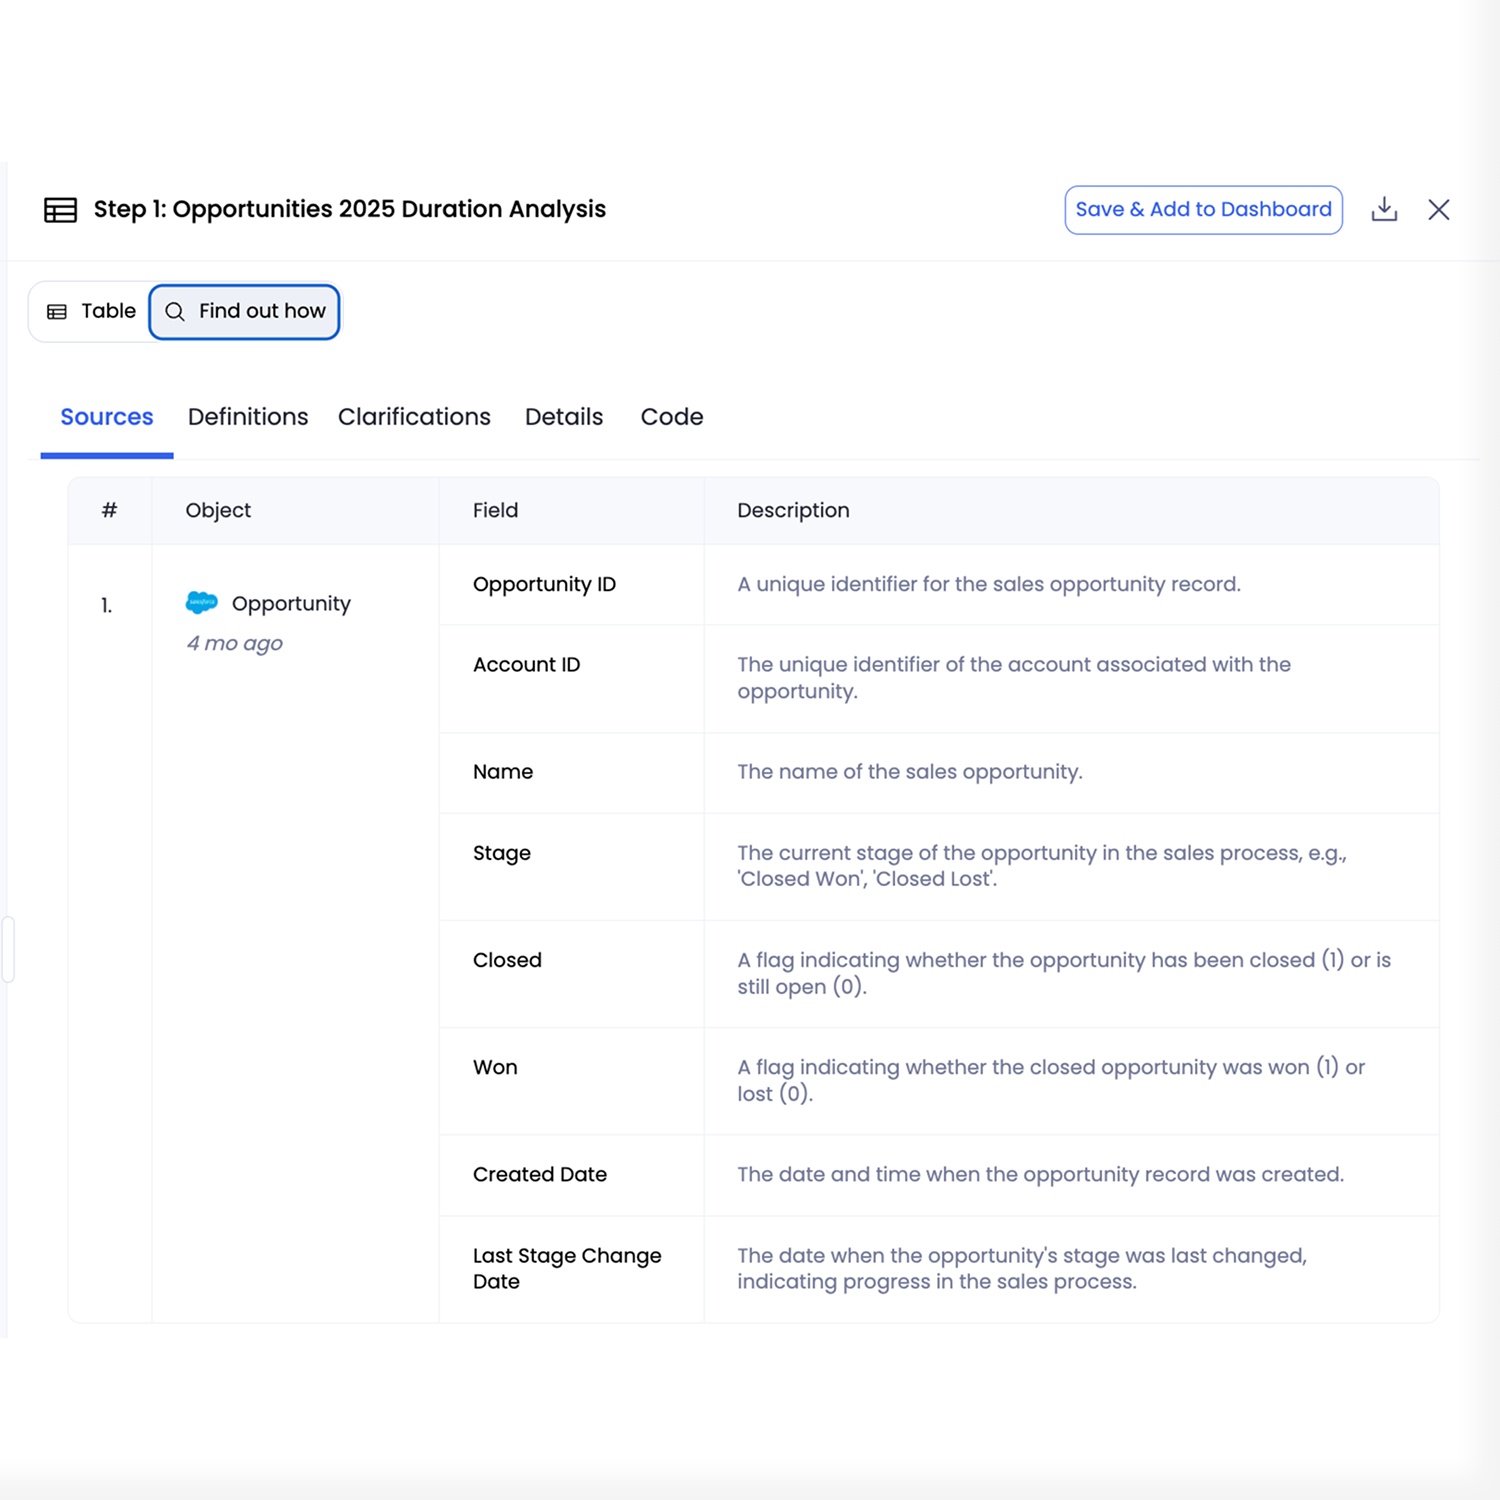
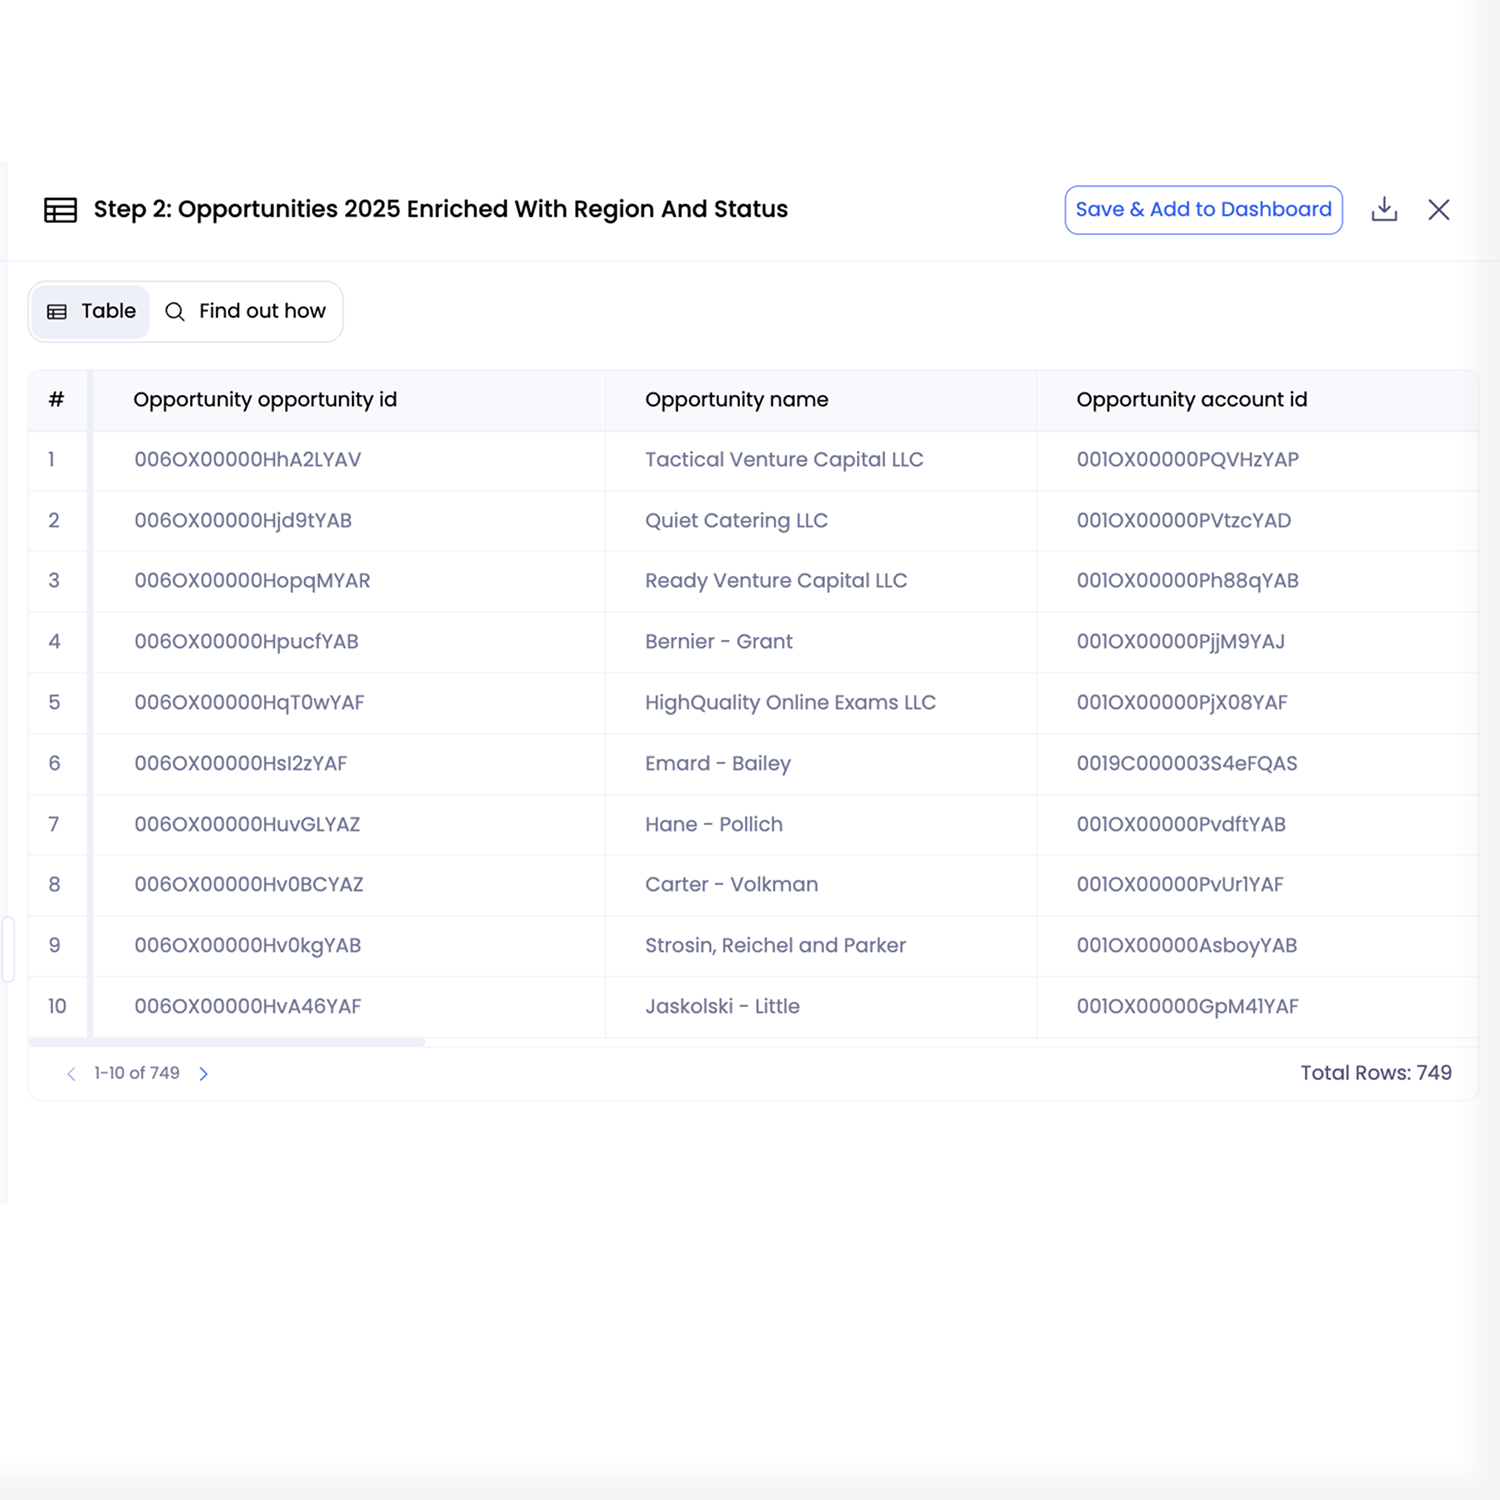
Analyze all opportunities created in 2025 that remained in Opportunity stage for more than 30 days. For these opportunities, provide a breakdown showing their current pipeline status as of today, categorized as
Interpret
~ 1 min
Plan

Craft the Plan

Petavue translates the request into a structured analytical plan.It selects the Salesforce Opportunities table and identifies required fields, including opportunity creation date, stage history, current stage, close status, close date, and region.Petavue defines stagnation logic (30+ days in Opportunity stage), establishes outcome categories, and outlines how global and regional summaries will be computed.

Review
~ 1.5 mins
Approve

Confirm the Approach

Before execution, Petavue presents the methodology in plain language.It explains how time-in-stage is calculated, how “later stage” vs. “still in Opportunity” is defined, and how closed outcomes are classified—ensuring stakeholders align on the analysis before results are generated.

Verify
~ 2 mins
Execute

Ensure Accurate Execution

Petavue runs the approved analysis across all eligible 2025 opportunities.It tracks stage-duration history, assigns each opportunity to its current outcome category, and validates calculations at the individual deal level.All results reflect live CRM data with no sampling, ensuring an accurate representation of pipeline behavior.

Compose
~ 1.5 mins
Present

Surface the Insights

Petavue translates the findings into actionable insights.It delivers a global summary showing how stalled opportunities ultimately resolved and a regional comparison highlighting where deals most often recover, close, or remain stuck.The output helps leaders identify regions with healthy recovery patterns versus those where early stagnation signals systemic risk.

The Outcome

Petavue analyzed 9,840 Salesforce opportunities created in 2025 to identify deals that stalled in the Opportunity stage for more than 30 days and track their eventual outcomes. By comparing current pipeline status globally and by region, Petavue revealed how early-stage stagnation translates into wins, losses, or prolonged deal cycles—giving revenue teams a fact-based view of pipeline health and risk.

Stalled Deal Outcomes

Quantified how many early-stalled opportunities ultimately closed versus remained stuck or progressed slowly.

Regional Variance

Revealed significant differences by region in recovery rates from early-stage stagnation.

Pipeline Risk Signal

Validated time-in-stage as a leading indicator for deal health and forecasting confidence.

FAQs

For any further questions, send us a message at support@petavue.com